

การเทรด
สำรวจตลาดที่หลากหลายด้วยราคาที่แข่งขันได้ สภาพคล่องสูง และเครื่องมือการเทรดขั้นสูง
เรียนรู้เพิ่มเติม 
แพลตฟอร์ม
เทรดอย่างไร้รอยต่อกับแพลตฟอร์มอันทรงพลังของ TMGM ที่สร้างขึ้นเพื่อความรวดเร็ว แม่นยำ และประสบการณ์การเทรดที่เหนือกว่า
เรียนรู้เพิ่มเติม แพลตฟอร์มการเทรด
เครื่องมือการเทรด
สถาบัน
เรียนรู้พื้นฐานการเทรดด้วยแหล่งข้อมูลสำหรับผู้เริ่มต้น รวมถึงคู่มือ สัมมนาออนไลน์ และข้อมูลเชิงลึกตลาด
เรียนรู้เพิ่มเติม ข่าว & วิเคราะห์
รับข้อมูลอัปเดตตลาดแบบเรียลไทม์และบทวิเคราะห์จากผู้เชี่ยวชาญเพื่อคว้าโอกาสการเทรดก่อนใคร
เรียนรู้เพิ่มเติม ข่าว & วิเคราะห์
เกี่ยวกับ
เรียนรู้สิ่งที่ทำให้ TMGM โดดเด่น — การดำเนินงานทั่วโลก ความแข็งแกร่งด้านการกำกับดูแล และความมุ่งมั่นสู่การสร้างสรรค์นวัตกรรมในการเทรด
เรียนรู้เพิ่มเติม ทำไมต้องเลือก TMGM
Solana Price Forecast: SOL stalls around $100 amid weak institutional demand
- Solana hovers above $100 on Monday after a 2% decline the previous week, marking its third straight week of losses.
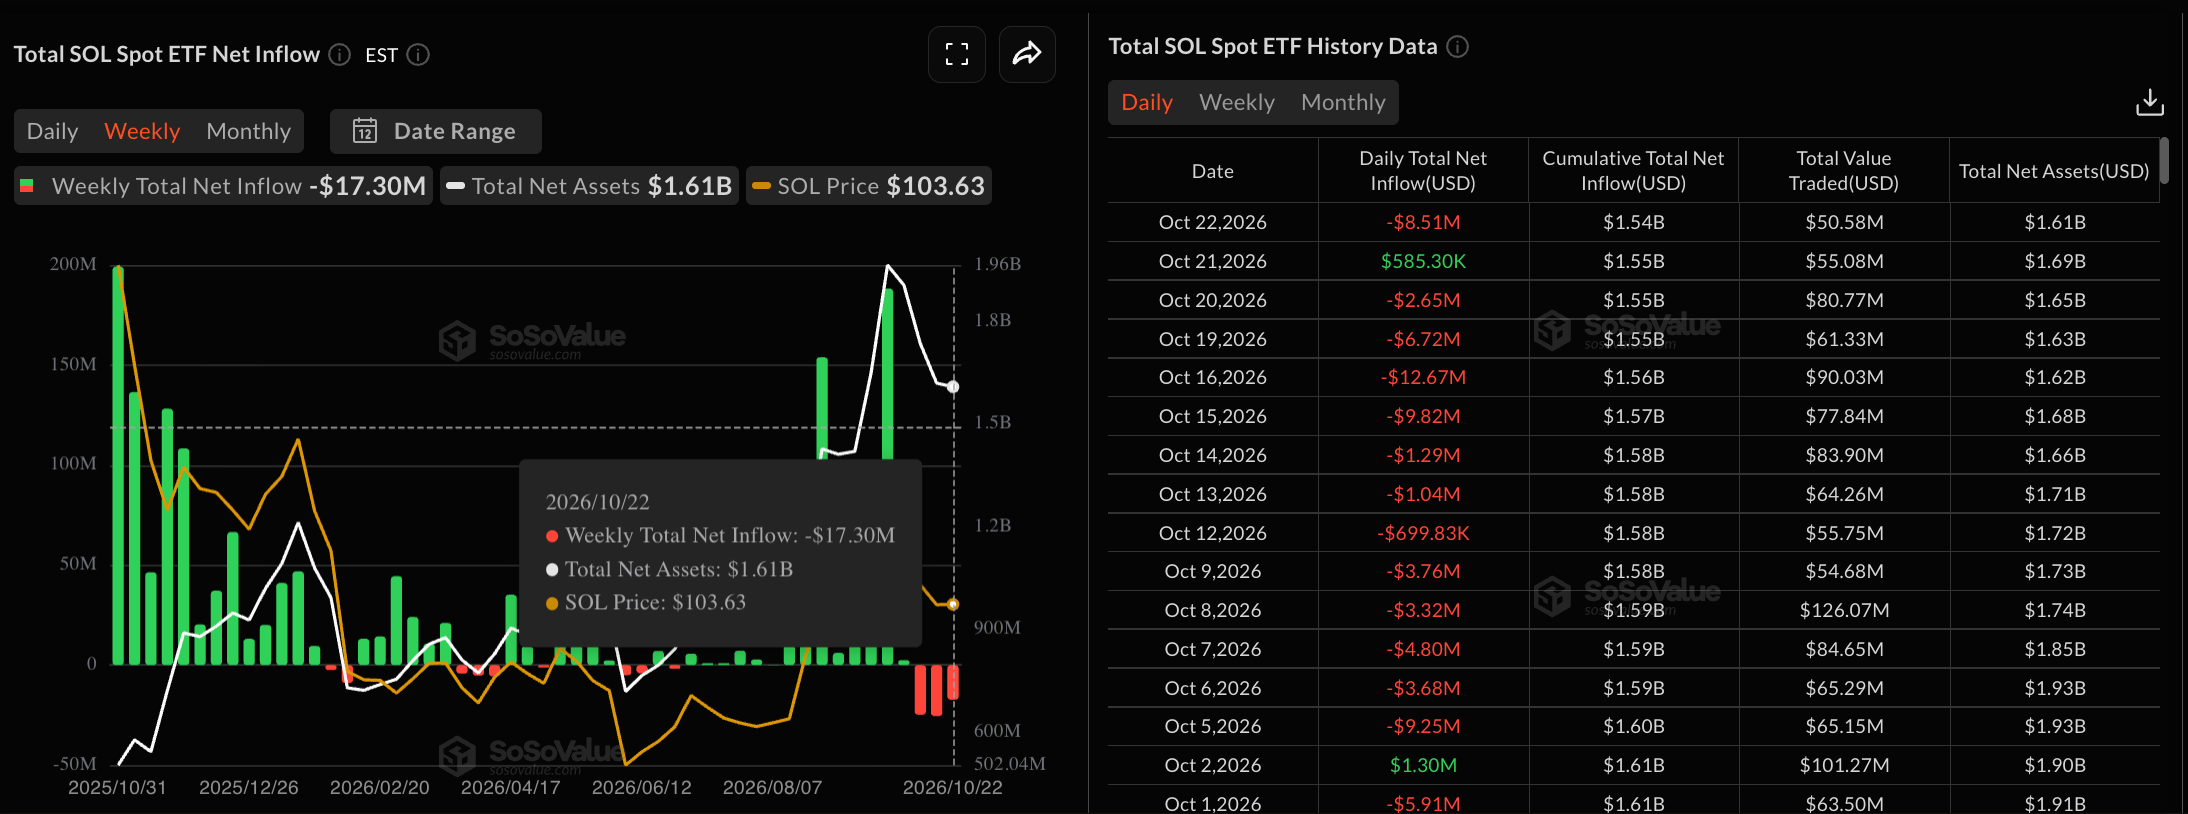
- SOL-focused ETFs recorded over $8 million in outflows on Friday, bringing their weekly total to more than $17 million.
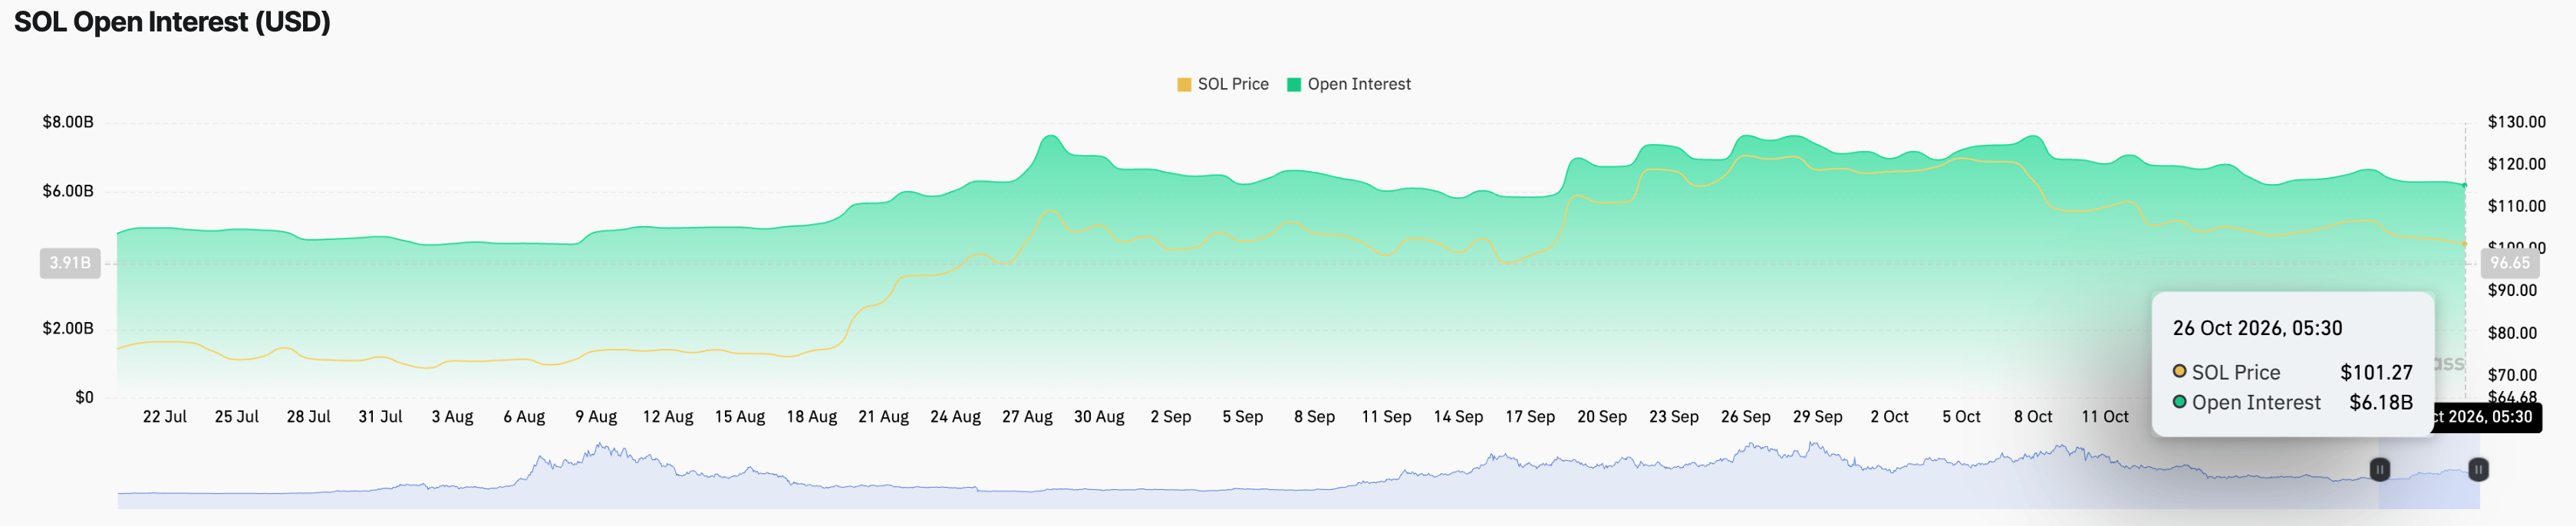
- Solana loses retail demand, with its futures Open Interest declining to $6.18 billion, from $6.34 billion last week.
Solana (SOL) price sustains above $100 on Monday, maintaining a near-term bearish bias after three consecutive weeks of losses, including a 2% decline last week. SOL-focused Exchange Traded Funds (ETFs) continue to face selling pressure from institutional investors, resulting in the third weekly outflow of over $17 million, while retail demand eases as Open Interest declines. The technical outlook for SOL is bearish, pressuring the long-term support of the 200-day Exponential Moving Average (EMA) around $98.

Solana ETFs face persistent selling pressure
Solana-focused ETFs face their third straight weekly outflow, with $17.30 million last week, bringing the monthly total to $72.24 million. Another week of outflows could push the monthly total above $1 million, marking the largest monthly outflow since June’s $786,580. Typically, ETF outflows suggest institutional investors are selling shares, reflecting reduced confidence in the underlying asset.
On the retail side, Solana futures are losing demand. CoinGlass data shows that SOL futures Open Interest (OI) is down to $6.18 billion on Monday, from $6.34 billion last week, indicating a reduced notional value of active contracts amid a declining spot price and a potential positional wipeout.
Taken together, the Layer-1 token continues to face weak demand, despite last week’s Alpenglow upgrade, which replaced the old TowerBFT system with a new engine, Votor, reducing transaction finality from roughly 12 seconds to a targeted 150 milliseconds.
Technical outlook: Will SOL price rebound from $100?
Solana trades at $101.45 at press time on Monday, retaining a capped bias below the 50-day EMA at $105.99 while staying above the 200-day EMA at $98.27. This split in the major averages suggests a corrective phase within a broader uptrend, with the upward-sloping support trendline around $86.67 reinforcing the underlying structure.
Momentum remains soft, as the Relative Strength Index (RSI) is at 36 on the daily chart, while the Moving Average Convergence Divergence (MACD) line is marginally below the signal line in negative territory, hinting at persistent downside pressure.
The 200-day EMA at $98.27 offers the first meaningful layer of support, and a confirmed break below it could extend the decline toward the rising trendline near $86.67, where stronger buying interest would be expected if the pullback continues.
On the topside, initial resistance is located at the 50-day EMA near $105.99, which guards the path toward the more distant horizontal barrier at the September 25 high of $122.94.
(The technical analysis of this story was written with the help of an AI tool. Know more.)
บทความยอดนิยม
1ดอลลาร์แคนาดาอ่อนค่าลง แม้ตลาดคาดว่าธนาคารกลางแคนาดา (BoC) จะปรับขึ้นอัตราดอกเบี้ย2ตลาดฟอเร็กซ์วันนี้: บรรยากาศตลาดดีขึ้นเล็กน้อยในช่วงเริ่มต้นสัปดาห์สำคัญของการประชุมธนาคารกลาง3ปอนด์อังกฤษ: มีโอกาสปรับขึ้นสู่ระดับ 1.3440 เมื่อเทียบกับดอลลาร์สหรัฐ – UOB4ยูโร: ความเสี่ยงเงินเฟ้อที่เพิ่มขึ้นคุกคามความสามารถในการยืนหยัด - Commerzbank5คาดการณ์ราคา GBP/USD: ต้องทะลุเหนือ 1.3420 อย่างชัดเจนเพื่อเปิดทางปรับขึ้นรอบใหม่6รูปีอินเดียเคลื่อนไหวอย่างระมัดระวังช่วงต้นสัปดาห์7คาดการณ์ราคา EUR/USD: ยังคงปรับตัวขึ้นเหนือ 1.1200 แต่แนวโน้มยังเป็นขาลงขณะอยู่ต่ำกว่าเส้น SMA 100 วัน8แรงซื้อดอลลาร์ออสเตรเลียดูยังลังเล โดยค่าเงินยังต่ำกว่าจุดสูงสุดในรอบหนึ่งเดือน ก่อนการประกาศ CPI ออสเตรเลียและการประชุม FOMC9ดัชนีดอลลาร์สหรัฐร่วงใกล้ 101.50 ท่ามกลางโอกาสที่เฟดจะคงอัตราดอกเบี้ยและความต้องการสินทรัพย์ปลอดภัยที่ลดลง
ราคาแบบเรียลไทม์

ทุกอย่างเกี่ยวกับ TECHNICAL
Breaker Block ในการเทรด: คืออะไร และเทรดอย่างไร
ทฤษฎีคลื่นเอลเลียต: รูปแบบ กฎเกณฑ์ และวิธีที่เทรดเดอร์นำไปใช้
Smart Money Concept (SMC) คืออะไร และเทรดด้วยแนวคิดนี้อย่างไร
Order Block ในการเทรดคืออะไร และเทรดอย่างไร
อินดิเคเตอร์ Average True Range (ATR): สูตรคำนวณ วิธีอ่านค่า และวิธีใช้งาน
Judas Swing: ความหมาย กลยุทธ์การเทรดแบบ ICT และตัวอย่าง
การเทรดด้วยรูปแบบ Butterfly: วิธีระบุและเทรดรูปแบบฮาร์มอนิก Butterfly
รูปแบบลิ่มขาขึ้น (Rising Wedge) คืออะไร และเทรดอย่างไร?
รูปแบบสามเหลี่ยมขาลงคืออะไร และเทรดอย่างไร?

เชื่อมต่อกับเรา









ติดต่อเรา
โทร: +61 2 8036 8388
แฟกซ์: +61 2 8036 8388
อีเมล: support@tmgm.com
เว็บไซต์: https://www.tmgmsea.com



ข้อมูลที่ให้ไว้บนเว็บไซต์นี้มีลักษณะเป็นข้อมูลทั่วไปเท่านั้น และไม่ถือเป็นคำแนะนำทางการเงินส่วนบุคคล ก่อนดำเนินการใด ๆ ตามข้อมูลบนเว็บไซต์นี้ คุณควรพิจารณาความเหมาะสมของข้อมูลดังกล่าวให้สอดคล้องกับวัตถุประสงค์ สถานะทางการเงิน และความต้องการของคุณ การลงทุนใน CFD และสัญญา FX Margin มีความเสี่ยงอย่างมีนัยสำคัญ และไม่เหมาะสำหรับนักลงทุนทุกคน คุณอาจสูญเสียเงินมากกว่าเงินฝากเริ่มต้นของคุณ คุณไม่ได้เป็นเจ้าของ หรือมีส่วนได้เสียใด ๆ ในสินทรัพย์อ้างอิง เราแนะนำให้คุณขอคำแนะนำอย่างเป็นอิสระ และตรวจสอบให้แน่ใจว่าคุณเข้าใจความเสี่ยงที่เกี่ยวข้องอย่างถ่องแท้ก่อนทำการซื้อขาย สิ่งสำคัญคือคุณต้องอ่านและพิจารณาเอกสารการเปิดเผยข้อมูลก่อนที่คุณจะได้มาซึ่งผลิตภัณฑ์ใด ๆ ที่ระบุไว้บนเว็บไซต์ ข้อมูลและโฆษณาที่นำเสนอบนเว็บไซต์นี้ไม่ได้มีวัตถุประสงค์เพื่อให้บุคคลใด ๆ ในประเทศหรือเขตอำนาจศาลใด ๆ ใช้งาน หากการใช้งานดังกล่าวขัดต่อกฎหมายและข้อบังคับท้องถิ่น ผลิตภัณฑ์และบริการที่นำเสนอบนเว็บไซต์นี้ไม่ได้มีไว้สำหรับผู้พำนักอาศัยในสหรัฐอเมริกา มาเลเซีย และประเทศไทย
TMGM ได้รับอนุญาตและอยู่ภายใต้การกำกับดูแลในหลายเขตอำนาจศาล
Trademax Australia Limited ซึ่งดำเนินธุรกิจในชื่อ TMGM ได้รับการกำกับดูแลโดย Australian Securities and Investments Commission (ASIC) หมายเลขใบอนุญาต AFSL 436416 และตั้งอยู่ที่ Level 28, One International Tower, 100 Barangaroo Avenue, 2000 Sydney, NSW Australia.
อีเมล: support@tmgm.com.au
Trademax Global Limited ซึ่งดำเนินธุรกิจในชื่อ TMGM ได้รับอนุญาตและอยู่ภายใต้การกำกับดูแลโดย Vanuatu Financial Services Commission (VFSC) หมายเลขทะเบียน 40356 และจดทะเบียนที่ 1276, Kumul Highway, Port Vila, Vanuatu, Republic of Vanuatu.
อีเมล: support@tmgm.com
Trademax Global Markets (SE) Limited, ดำเนินการภายใต้ชื่อ TMGM, ได้รับอนุญาตและอยู่ภายใต้การกำกับดูแลโดย Financial Services Authority (FSA) ของเซเชลส์ ภายใต้เลขที่ใบอนุญาต SD224 บริษัทจดทะเบียนที่ สำนักงานเลขที่ 13, Providence Estate ABIS Centre, เกาะมาเฮ, เซเชลส์
อีเมล: support@tmgm.com
Trademax Global Markets (International) Pty Ltd ซึ่งดำเนินธุรกิจในชื่อ TMGM ได้รับอนุญาตและอยู่ภายใต้การกำกับดูแลโดย Financial Services Commission, Mauritius (FSC) หมายเลขใบอนุญาต GB22201012 และจดทะเบียนที่ 33, Edith Cavell Street C/o IQ EQ Fund Services (Mauritius) Ltd Port Louis, 11324 Mauritius.
อีเมล: support@tmgm.com
ลิขสิทธิ์ © TMGM สงวนลิขสิทธิ์ทั้งหมด