


Dogecoin Price Forecast: Extended correction and weakening momentum raise downside risks
- Dogecoin extends its correction, falling more than 5% and trading around $0.090 mid-week.
- Rising short positions and signs of overheated conditions among traders increase the risk of further downside in DOGE.
- The technical outlook shows weakening momentum, hinting at a deeper correction.
Dogecoin (DOGE) extends its losses, trading around $0.090 on Wednesday, down more than 5% so far this week. Bearish pressure is strengthening, with short positions reaching a one-month high and traders in overheated conditions. Meanwhile, weakening momentum indicators are also hinting at further losses in DOGE.
Dogecoin key metrics show bearish signs
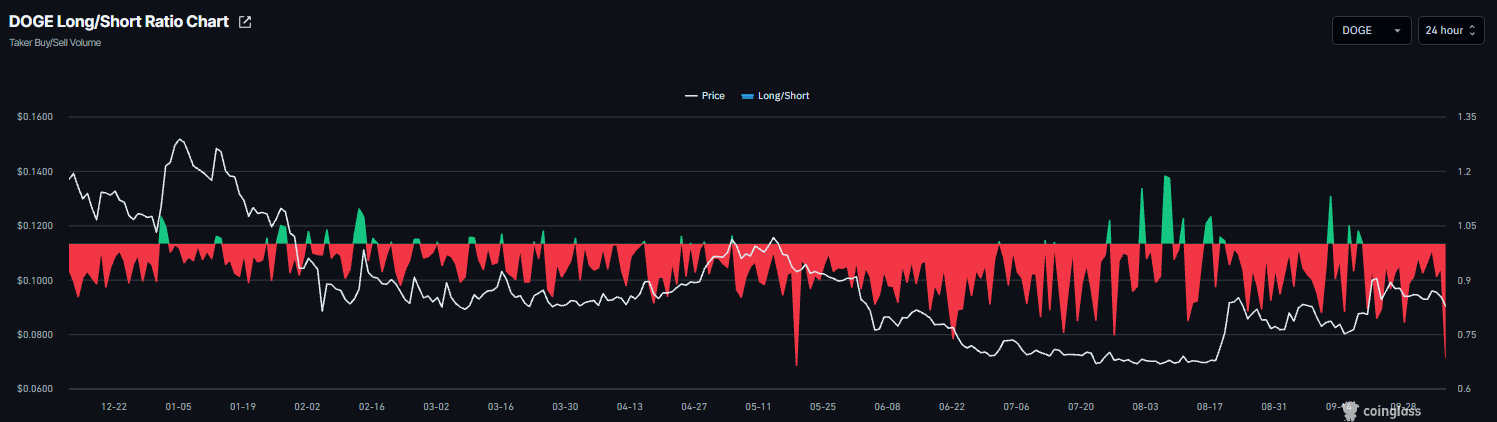
Derivatives data shows cautious signals among traders. CoinGlass’ long-to-short ratio for Dogecoin reads 0.68 on Wednesday, the lowest level over a month. A ratio being below one indicates bearish sentiment, as traders bet that asset prices will fall.
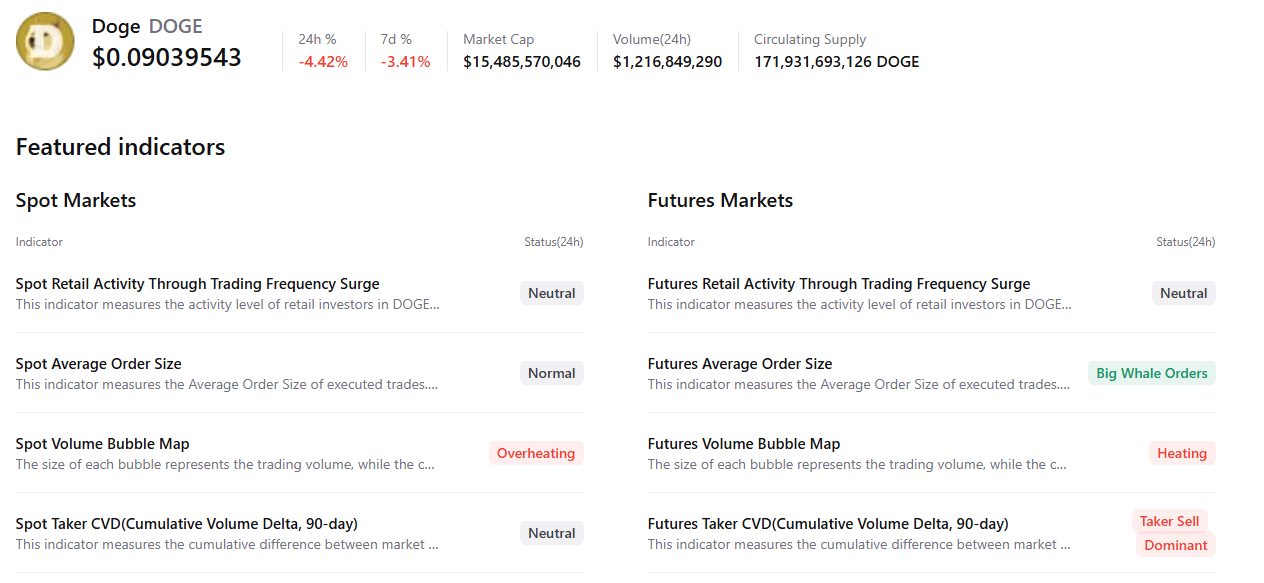
CryptoQuant’s summary data also shows a bearish outlook for the dog-themed meme coin. DOGE’s spot and futures markets show overheating conditions, while the futures market shows large whale orders but with sell-side dominance. These highlight a bearish, cautious sentiment bias among Dogecoin traders.
Dogecoin technical outlook: DOGE slips below key 200-day EMA
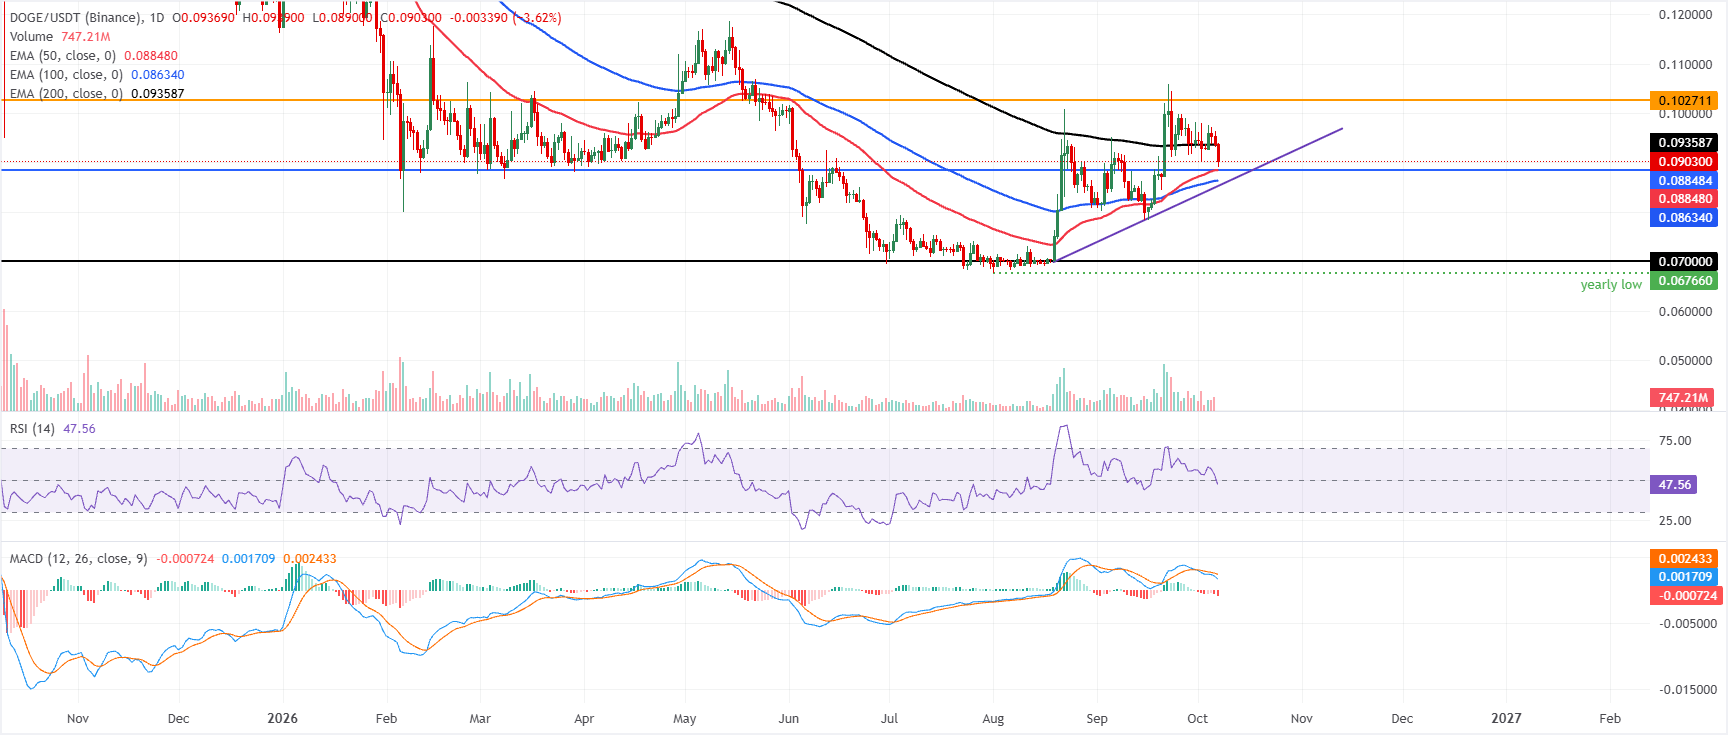
Dogecoin price trades at $0.090 on Wednesday, down over 5% so far this week. Despite the correction, DOGE remains mildly bearish in the near term, capped below the 200-day Exponential Moving Average (EMA) at $0.093. Price holds above the 50-day EMA at $0.088 and the 100-day EMA at $0.086, suggesting underlying demand still supports the broader uptrend structure, but the Relative Strength Index (RSI) near 48 and a slightly negative Moving Average Convergence Divergence (MACD) line hint at fading momentum while the pair consolidates under the recent highs.
On the downside, immediate support clusters around $0.088, where the 50-day EMA coincides with a horizontal level, followed by the 100-day EMA at $0.086 and the former trendline break area near $0.085; a daily close below this zone would open the way to the deeper horizontal floor at $0.070.
On the topside, DOGE would need to reclaim the 200-day EMA at $0.093 to ease bearish pressure, with the next notable resistance coming at the horizontal barrier around $0.102, where sellers are likely to re-emerge.
(The technical analysis of this story was written with the help of an AI tool. Know more.)
인기 기사
1Japan’s Takaichi to review policies, revenue and spending if rate shifts differ from expectations22.0%: Germany's Industrial Production rises faster-than-expected in August3AUD/JPY Price Forecast: Flatlines below 110.50, while technicals signal lingering bearish bias4Indonesian Rupiah holds losses as Foreign Reserves slip in September5GBP/USD Price Forecast: Downside pressure could intensify below 1.31806USD/JPY Price Forecast: Clings to gains near 158.50, over one-week top amid firmer USD7Swiss Franc declines ahead of release of Foreign Currency Reserves data8Dogecoin Price Forecast: Extended correction and weakening momentum raise downside risks9WTI Price Forecast: Sticks to gains near $89.50; bulls seem hesitant below 200-SMA on H4
실시간 시세


TECHNICAL에 대한 모든 것
ICT 트레이딩이란 무엇인가요? 이너 서클 트레이더(Inner Circle Trader) 개념 설명
지지선과 저항선: 의미, 유형, 레벨을 그리는 방법 및 트레이딩 전략
유동성이란 무엇인가요? 트레이딩 및 금융시장에서의 의미
유동성 스윕: 의미, 예시 및 트레이딩 전략
트레이딩의 시장 구조: 완벽 가이드 (상승장, 하락장, 횡보장)
캐릭터 변화 (CHoCH): 정의, 예시 및 전략
다크 클라우드 커버 패턴이란 무엇이며, 이를 어떻게 트레이딩하나요?
피어싱 라인 캔들스틱 패턴이란 무엇이며, 이를 어떻게 트레이딩하나요?
트위저 탑 및 바닥 캔들스틱 패턴이란 무엇인가요?

소셜 미디어












이 웹사이트에 제공된 정보는 일반적인 성격의 정보일 뿐이며 개인 맞춤형 금융 자문을 구성하지 않습니다. 이 웹사이트의 정보를 바탕으로 행동하기 전에, 귀하의 목표, 재정 상황 및 필요에 비추어 해당 정보의 적합성을 고려해야 합니다. CFD 및 FX 마진 계약에 대한 투자는 상당한 위험을 수반하며 모든 투자자에게 적합하지 않을 수 있습니다. 귀하는 최초 예치금보다 더 큰 손실을 입을 수 있습니다. 귀하는 기초자산에 대한 소유권이나 어떠한 이해관계도 보유하지 않습니다. 거래를 시작하기 전에 독립적인 자문을 구하고 관련 위험을 충분히 이해하시기를 권장합니다. 웹사이트에 기재된 상품을 취득하기 전에 공시 문서를 읽고 검토하는 것이 중요합니다. 이 웹사이트에서 제공되는 정보 및 광고는 그러한 사용이 현지 법률 및 규정에 위배되는 국가 또는 관할권의 개인이 사용하도록 의도된 것이 아닙니다. 이 웹사이트에서 제공되는 상품 및 서비스는 미국, 말레이시아 및 태국 거주자를 대상으로 하지 않습니다.
TMGM은 다양한 관할권에서 승인 및 규제를 받고 있습니다.
TMGM으로 거래하는 Trademax Australia Limited는 호주 증권투자위원회(ASIC)의 규제를 받으며, AFSL 번호 436416이고 Level 28, One International Tower, 100 Barangaroo Avenue, 2000 Sydney, NSW Australia에 위치하고 있습니다.
이메일: support@tmgm.com.au
TMGM으로 거래하는 Trademax Global Limited는 바누아투 금융서비스위원회(VFSC)의 승인 및 규제를 받으며, 등록 번호 40356이고 1276, Kumul Highway, Port Vila, Vanuatu, Republic of Vanuatu에 등록되어 있습니다.
이메일: support@tmgm.com
Trademax Global Markets (SE) Limited(이하 TMGM)는 세이셸 금융청(FSA)의 인가 및 규제를 받으며, 허가 번호는 SD224입니다. 회사는 세이셸 마헤, 프로비던스 에스테이트 ABIS 센터, 사무실 번호 13에 등록되어 있습니다.
이메일: support@tmgm.com
TMGM으로 거래하는 Trademax Global Markets (International) Pty Ltd는 모리셔스 금융서비스위원회(FSC)의 승인 및 규제를 받으며 라이선스 번호 GB22201012이고, 33, Edith Cavell Street C/o IQ EQ Fund Services (Mauritius) Ltd Port Louis, 11324 Mauritius에 등록되어 있습니다.
이메일: support@tmgm.com
Copyright © TMGM. All rights reserved