


Crypto Today: Bitcoin, Ethereum and XRP edge lower despite strong institutional buying
- Bitcoin slides and trades below $83,000 on Monday as headwinds return, undeterred by $2.4 billion in weekly ETF inflows.
- Ethereum sellers return as price slips below $2,650, even as steady institutional support persists through spot ETFs.
- XRP retreats 10% from its September highs near $1.66, hovering below $1.50 while aligning with weakening momentum indicators.
Cryptocurrency prices are broadly moderating on Monday, with Bitcoin (BTC) hovering below $83,000 at the time of writing. Ethereum (ETH) and Ripple (XRP) reflect BTC’s weakness, as sellers return, pushing prices below $2,650 and $1.50, respectively.

The next few days will indicate the crypto market's direction after last week’s rally. For Bitcoin, traders should watch the $80,000 level, which, if broken, could deepen the sell-off, while defending the area as support may trigger fresh buying and a subsequent rally.
Crypto ETFs attract strong institutional demand
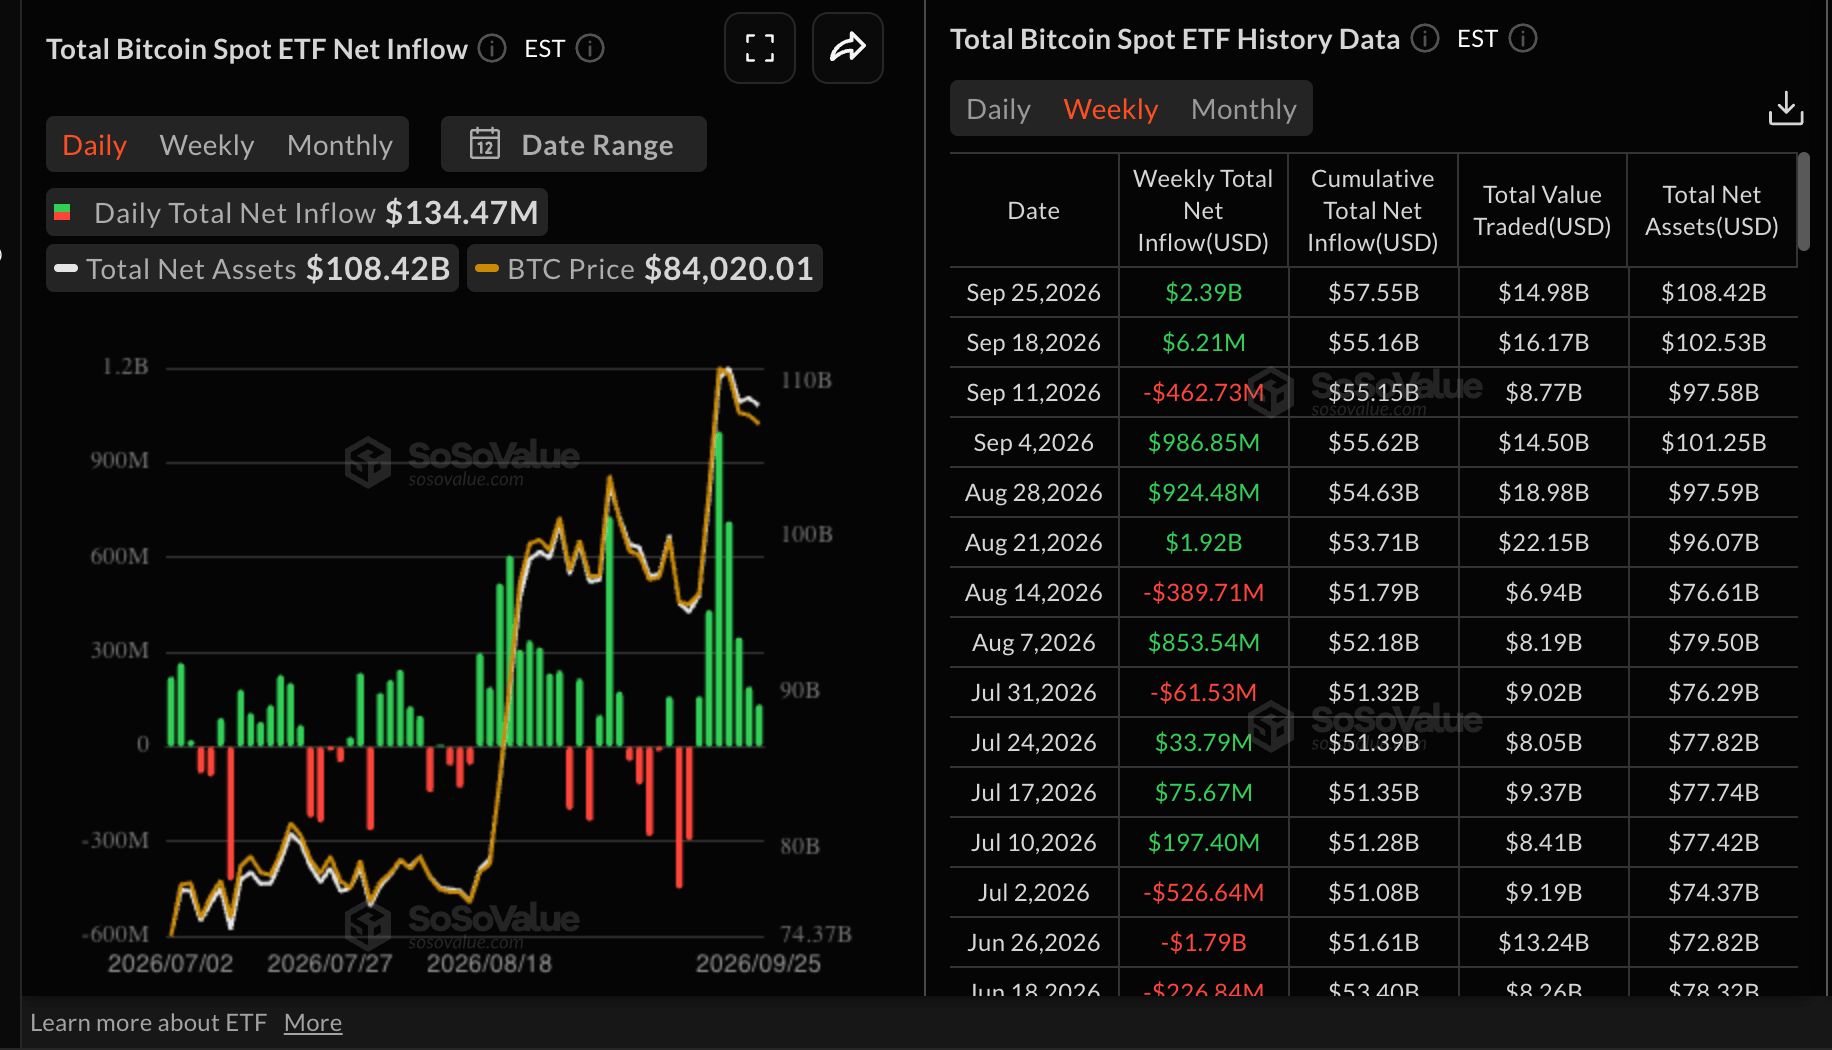
Bitcoin spot Exchange-Traded Funds (ETFs) posted another successful week, with inflows to $2.4 billion last week, from a mere $6.2 million the previous week. Cumulative inflows ticked up near $58 billion, with net assets under management averaging $108 billion, according to SoSoValue data. The surge in institutional demand supports a short to medium-term bullish outlook and provides trend support.
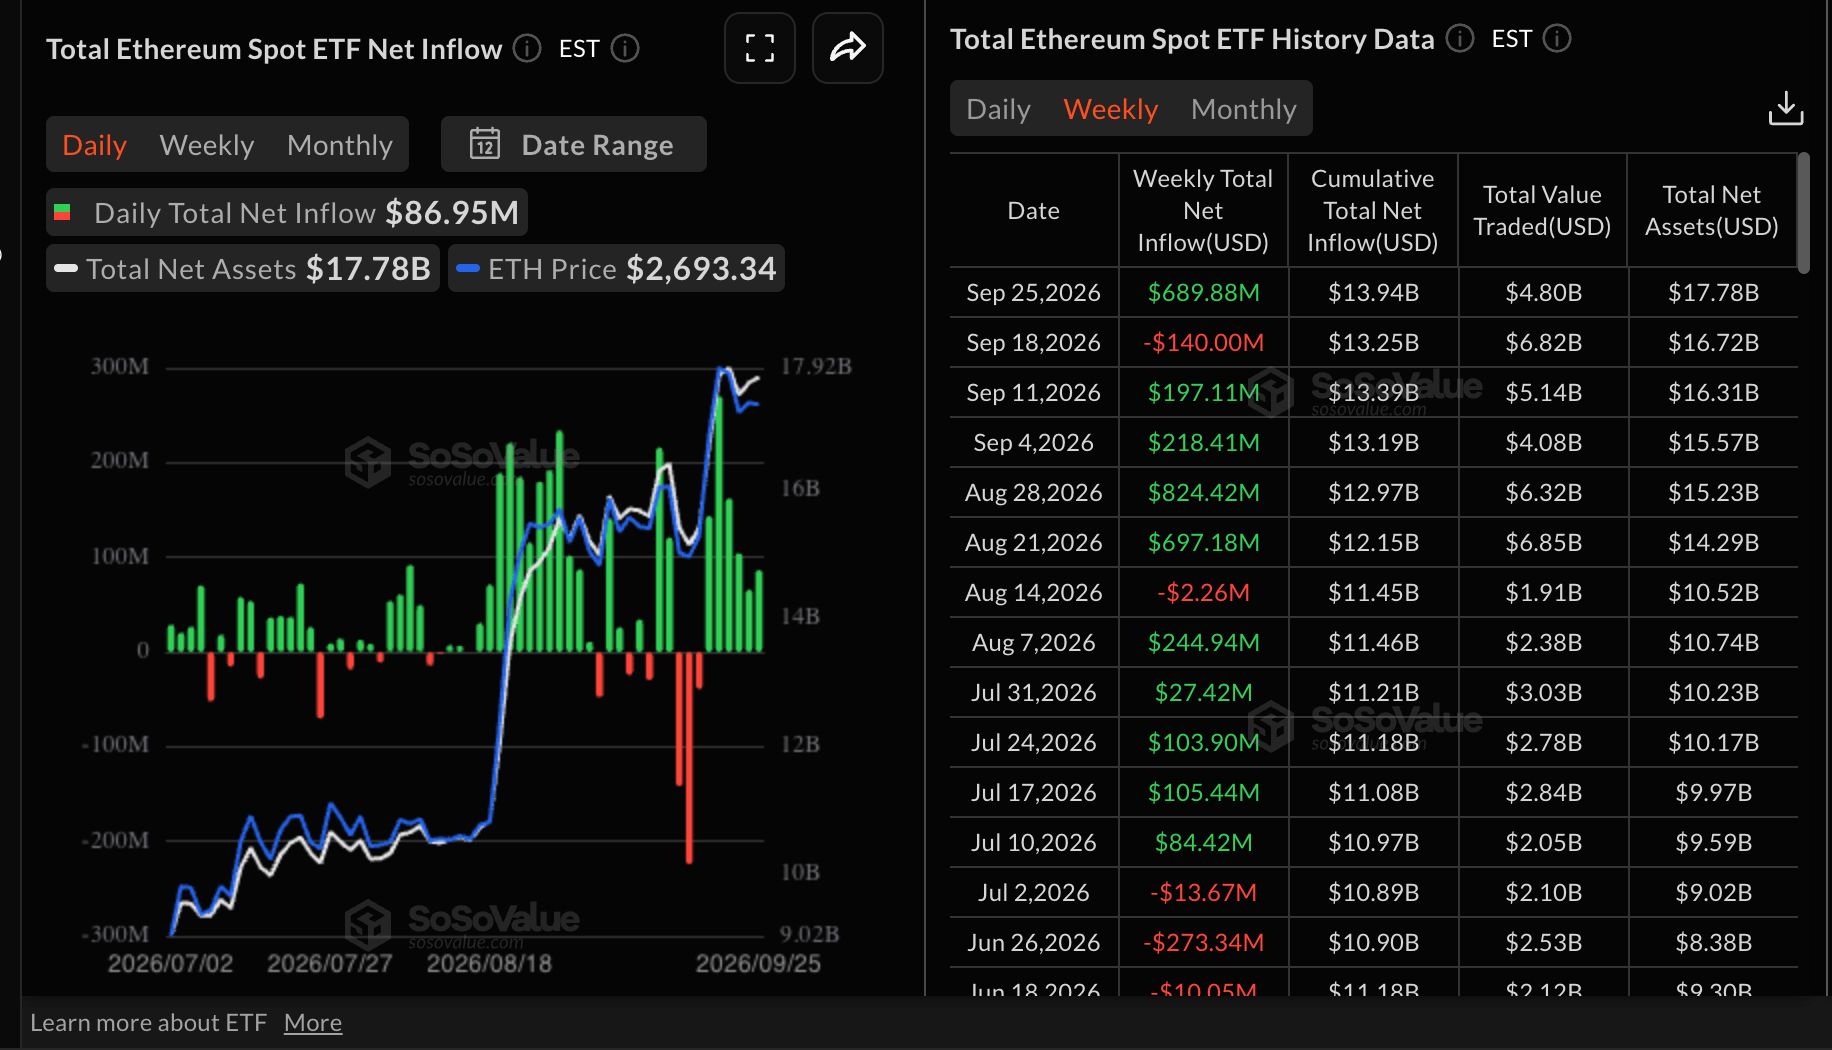
Ethereum spot ETFs recovered last week, with inflows totaling $690 million on Monday, following outflows of $140 million the week before. The return of institutional demand underpins Ethereum’s near-term bullish outlook, with cumulative inflows edging higher at $14 billion while net assets under management average $18 billion.
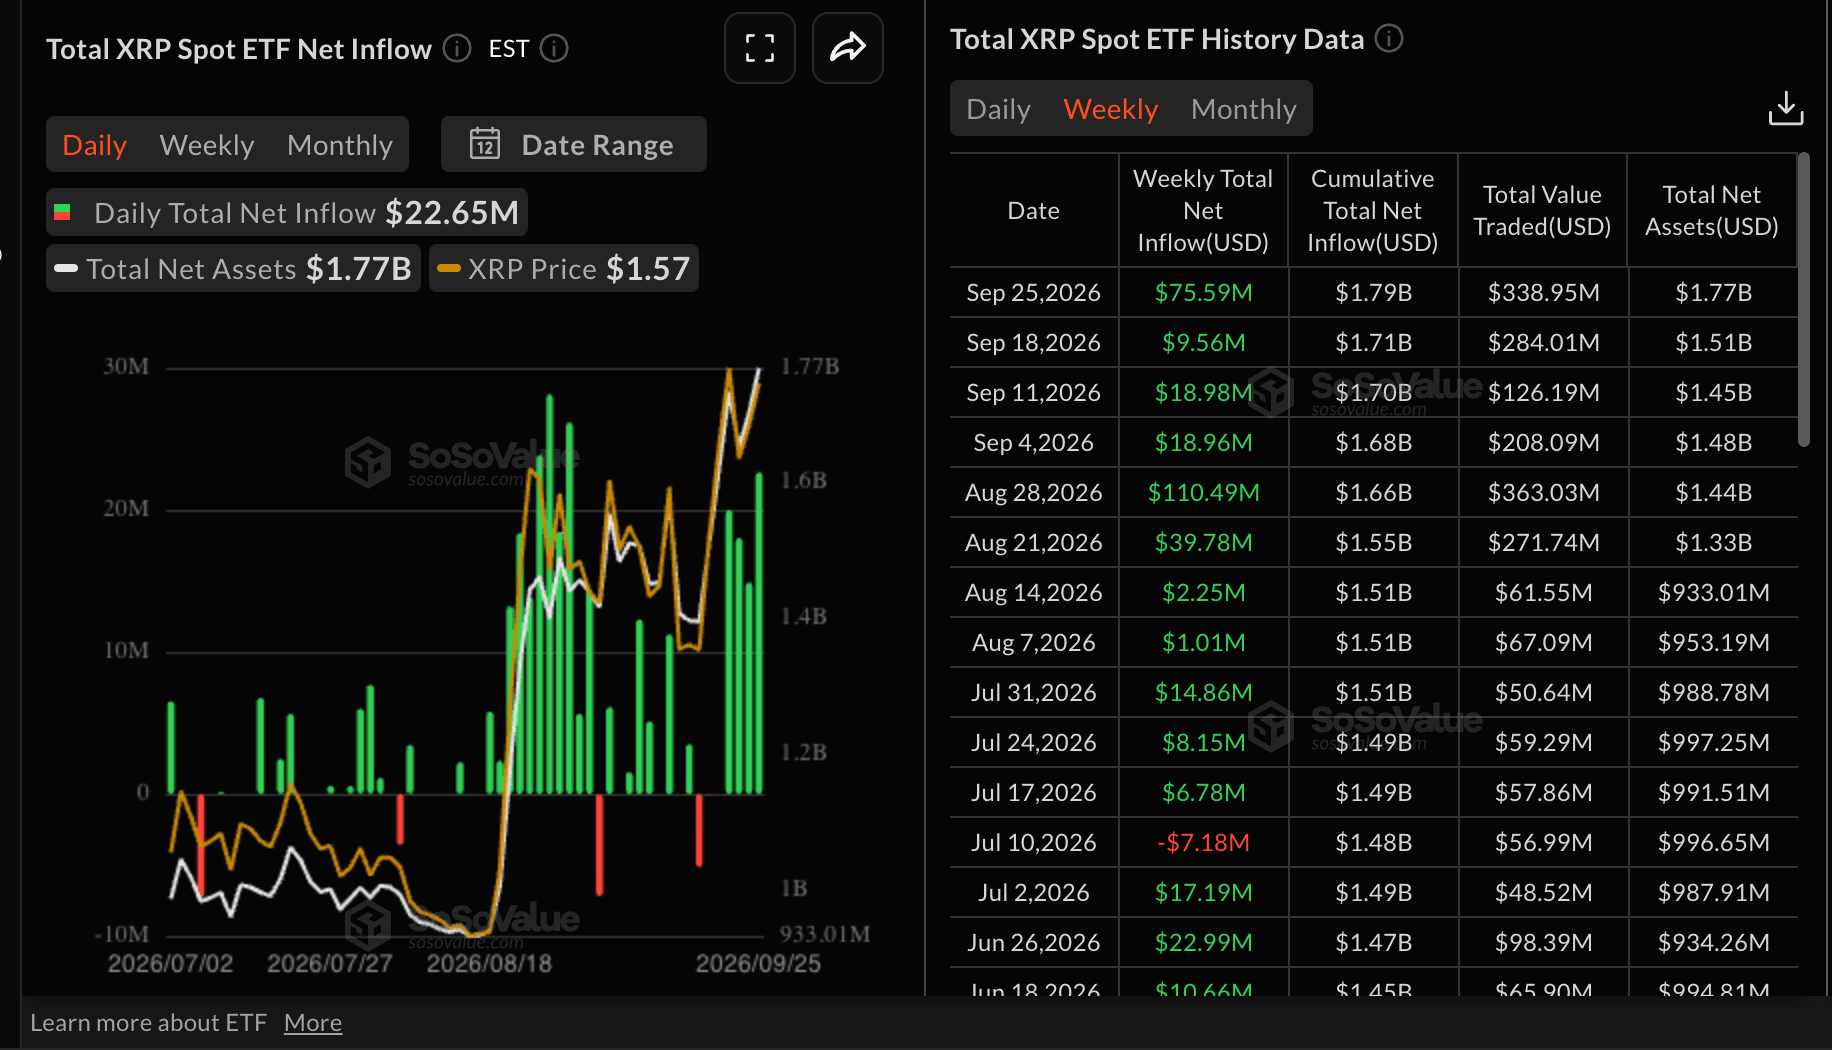
XRP, meanwhile, recorded inflows of $76 million last week, increasing from the $10 million posted the week before. This also marked the 11th consecutive week of inflows, underscoring institutional demand and interest in the cross-border transfer token. Cumulative inflows currently stand at $1.8 billion, with net assets under management also at $1.8 billion.
Technical analysis: Bitcoin momentum cools
Bitcoin trades below $83,000 but maintains a bullish near-term bias, as price remains well above the 50-day, 100-day, and 200-day Exponential Moving Averages (EMAs), suggesting a well-supported uptrend. The SuperTrend indicator at $78,352 also sits below the market, reinforcing underlying demand, while the Relative Strength Index (RSI) near 58 hints at constructive but not overextended momentum, and the Moving Average Convergence Divergence (MACD) hovers just above zero with a modest positive reading, pointing to steady rather than explosive upside pressure.
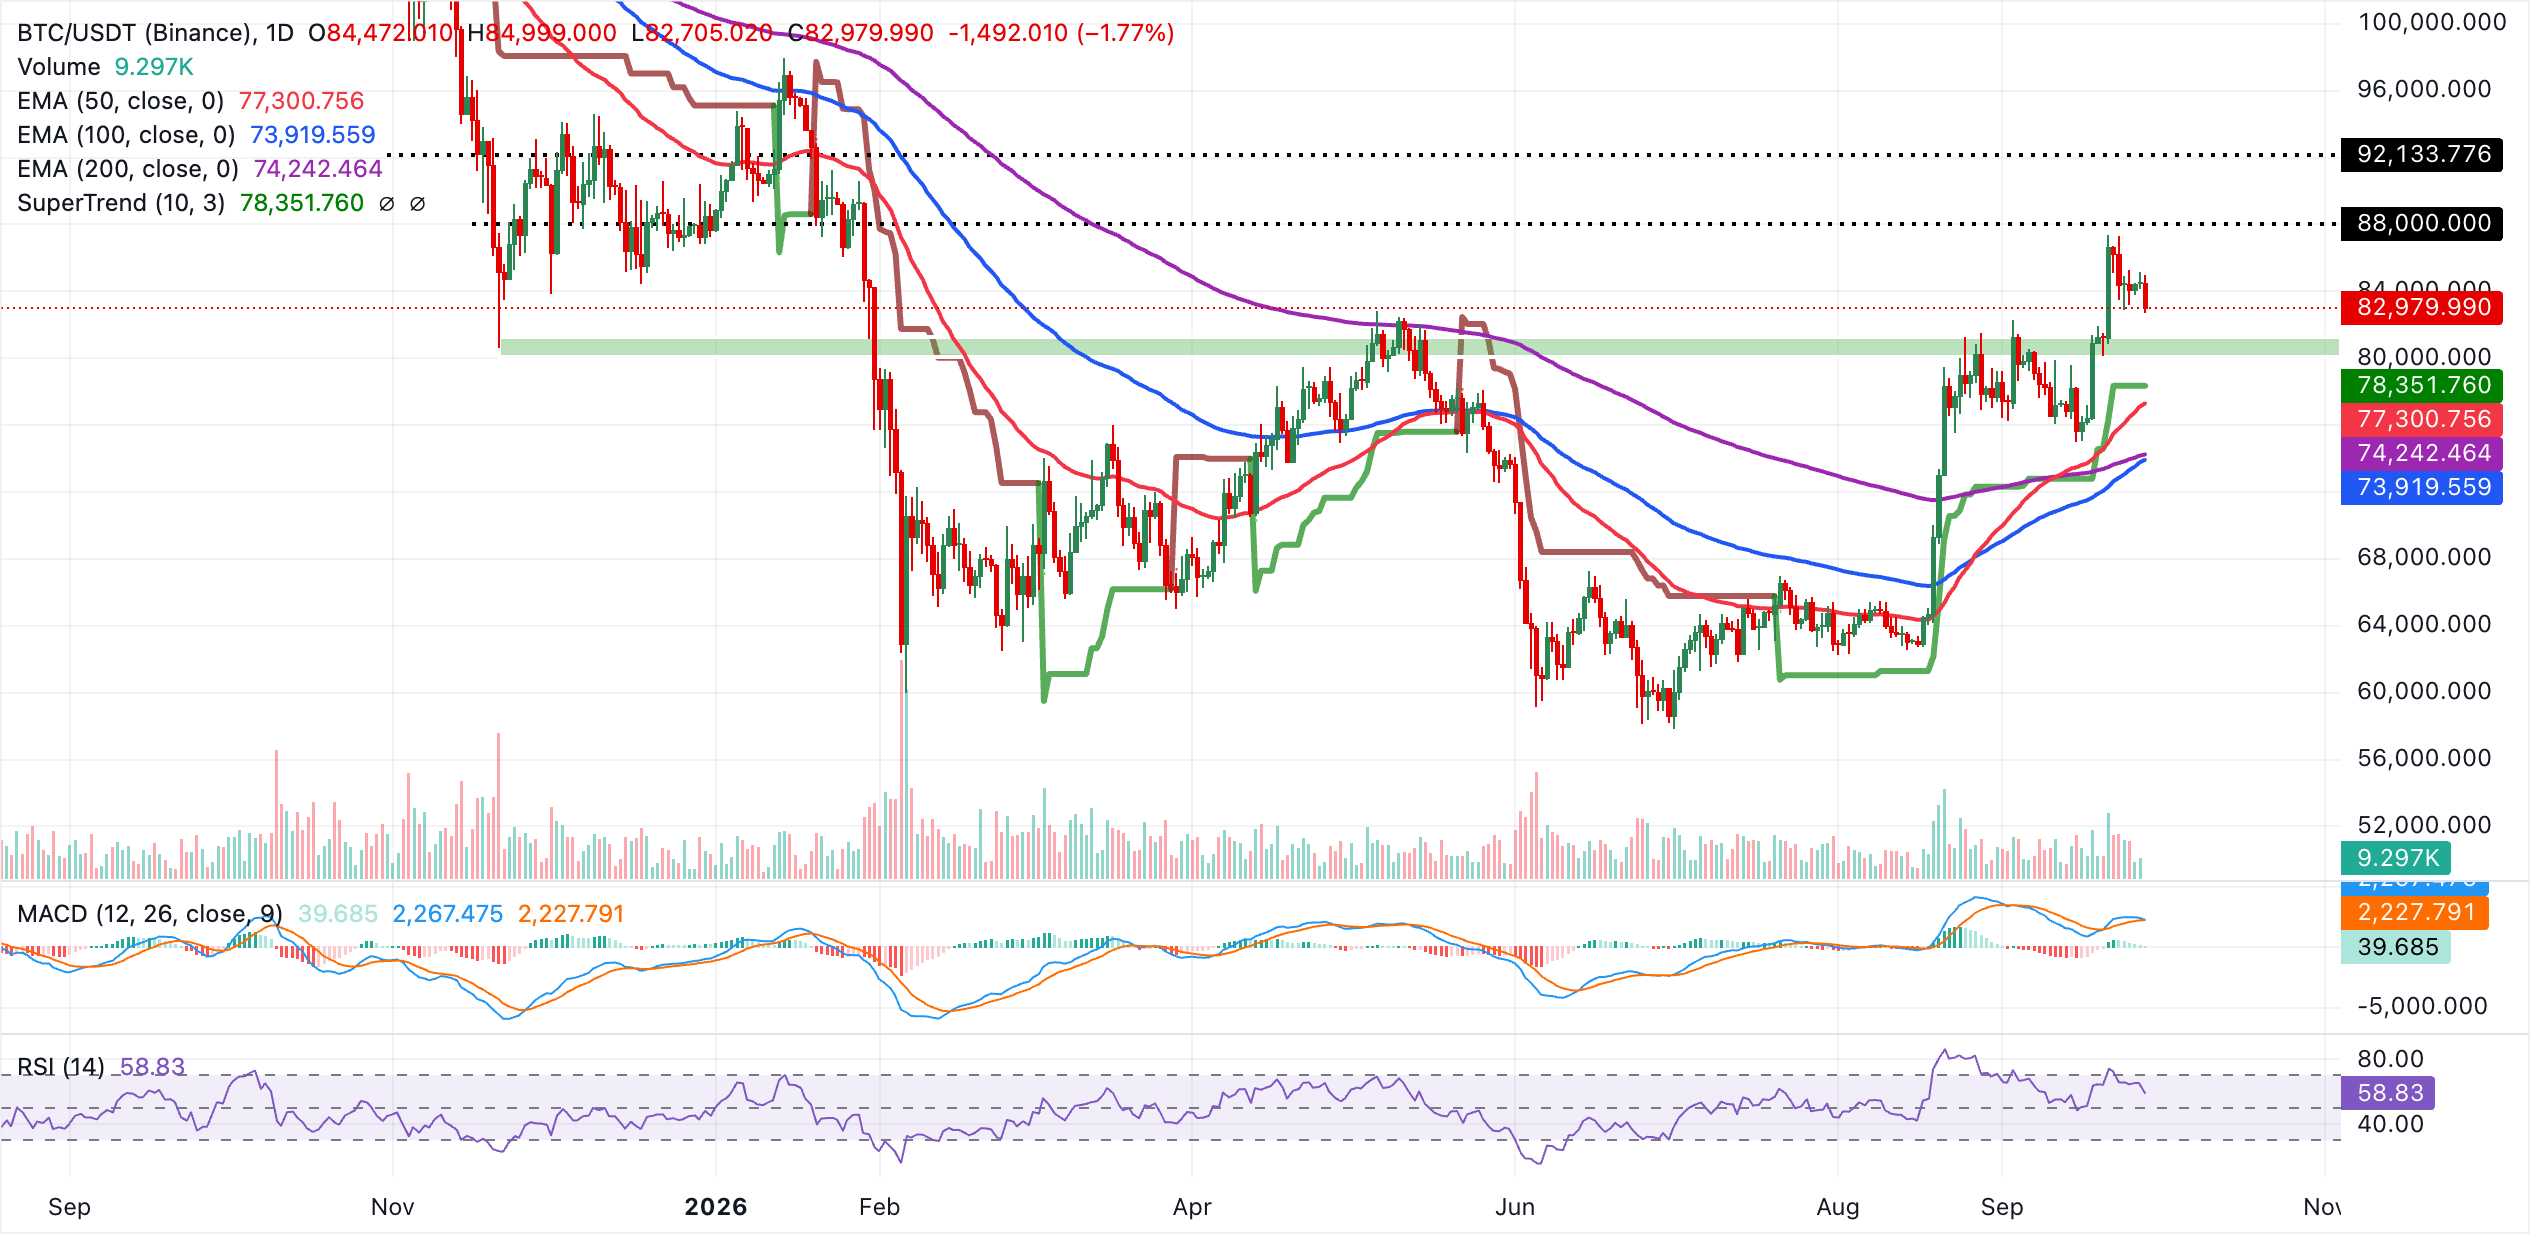
Immediate support is found at the current pivot area around $83,000, ahead of a first technical floor clustered between the SuperTrend signal at $78,352 and the 50-day EMA at $77,301. Deeper pullbacks would likely target the broader dynamic base defined by the 200-day EMA at $74,242 and the 100-day EMA at $73,920, where buyers are expected to defend the prevailing bullish structure as long as daily closes hold above this zone.
Altcoins technical analysis: Ethereum and XRP correction persists
Ethereum trades downward at $2,651, maintaining a bullish near-term bias as price holds well above its key EMAs. The pair is supported by the 50-day EMA around $2,426 and the SuperTrend line near $2,434, suggesting buyers remain in control as dips are absorbed above these dynamic trend markers.
Momentum is constructive, with the RSI hovering just under 60, although the MACD has slipped slightly into negative territory, hinting that upside momentum is moderating rather than reversing.
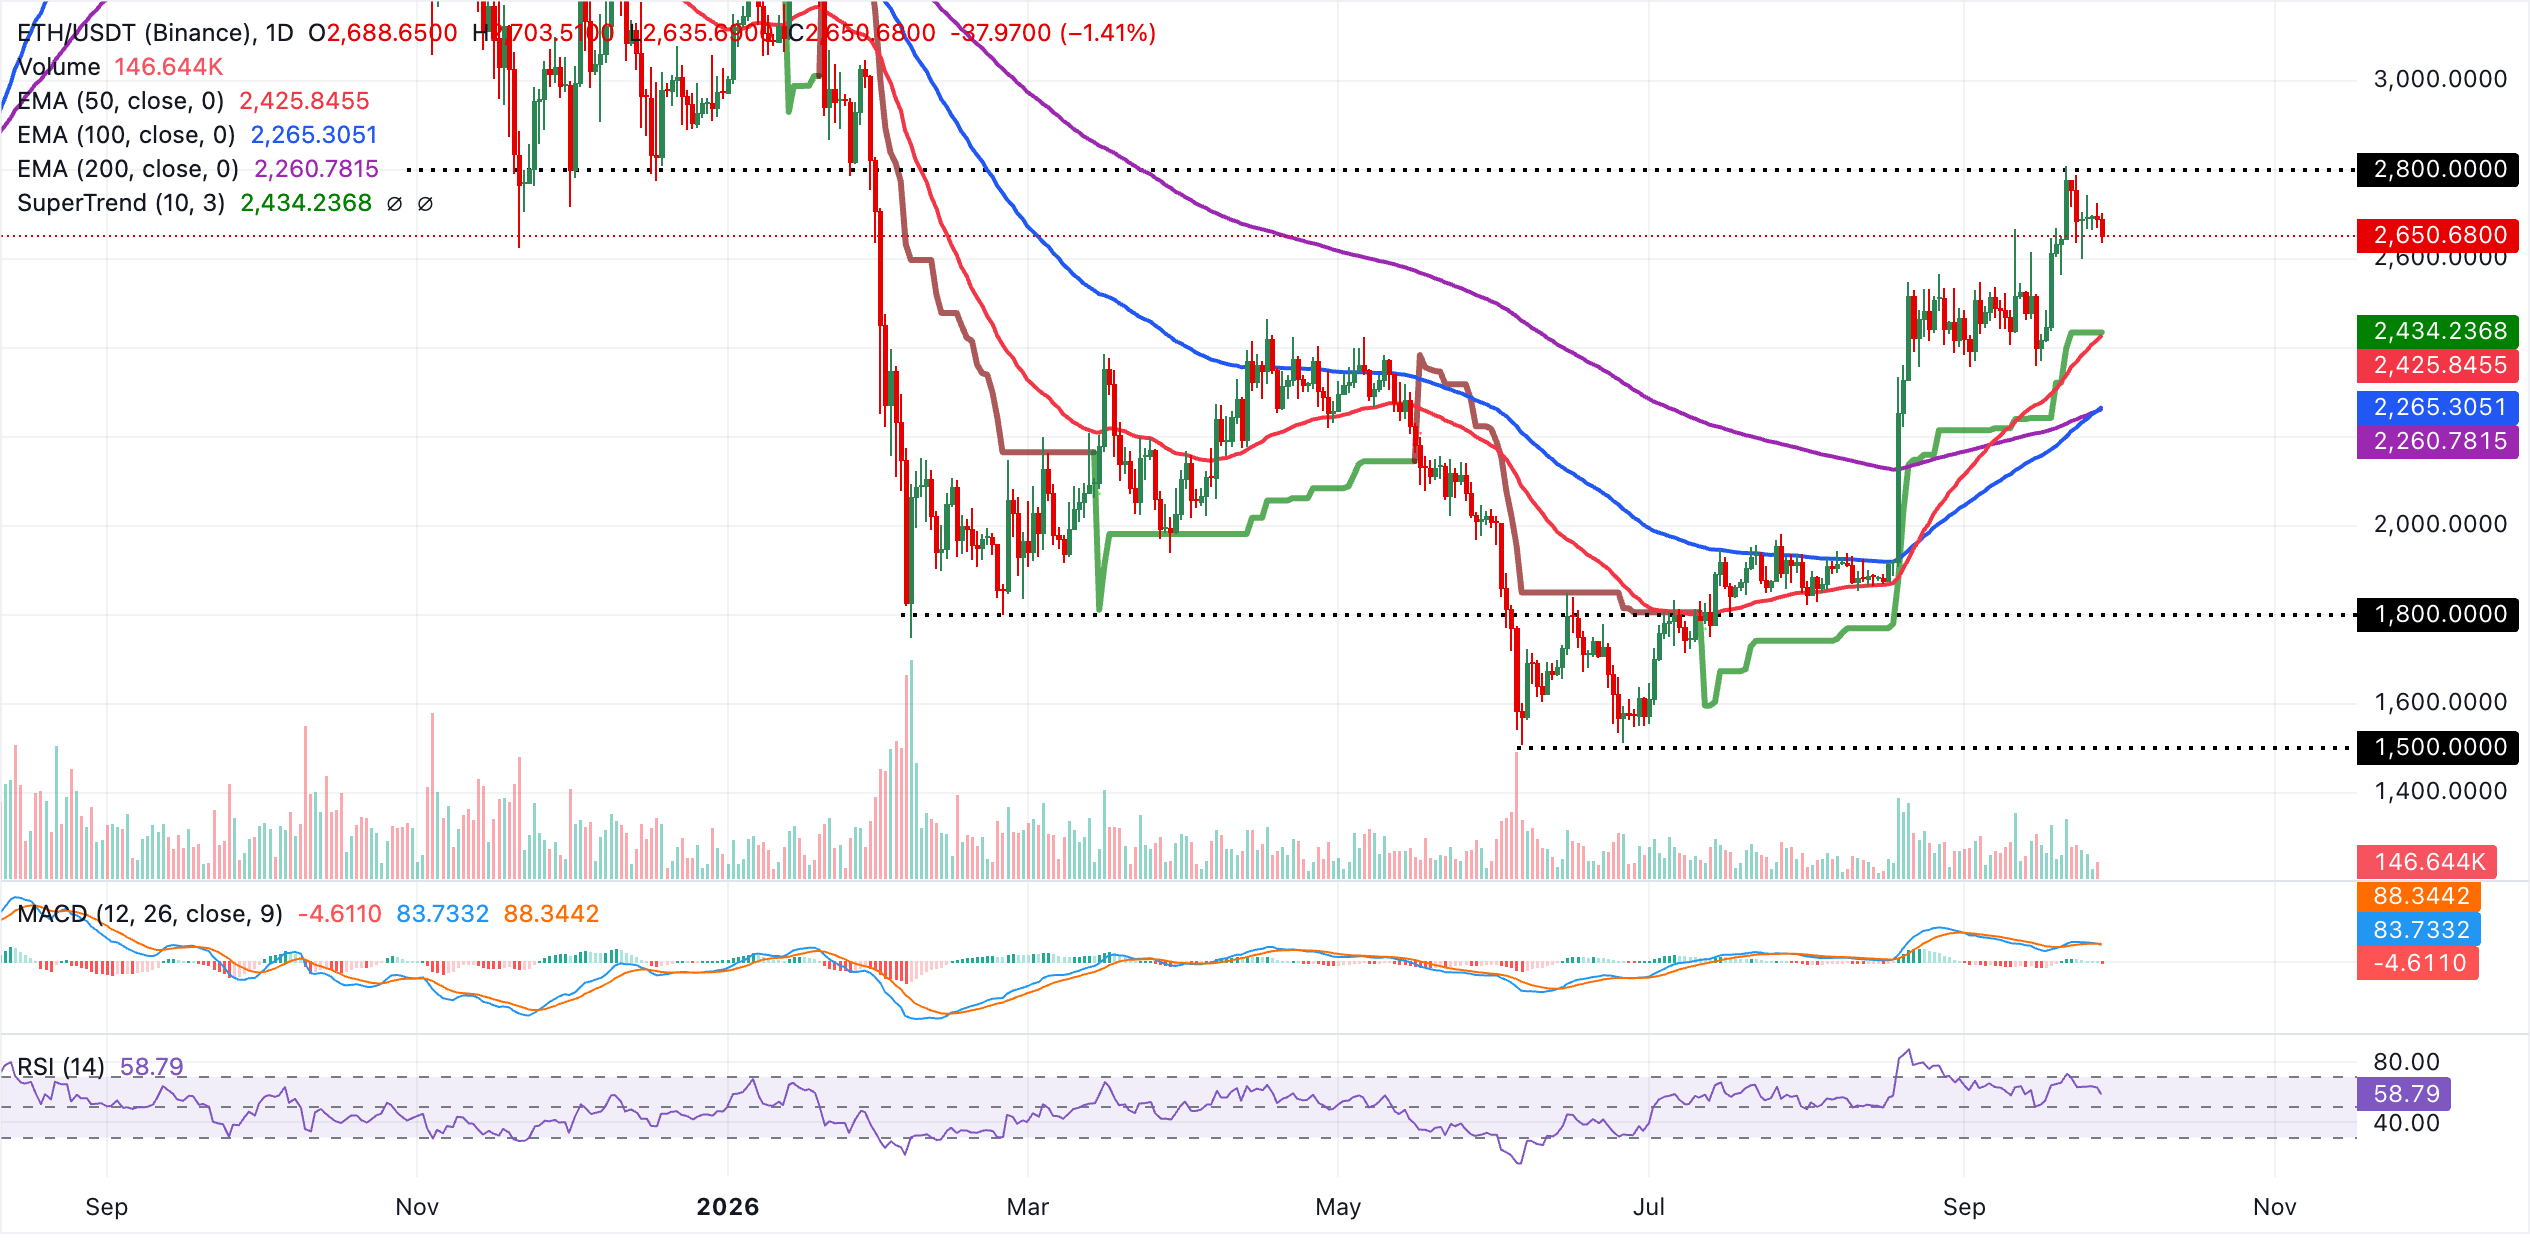
Initial support lies in the $2,425-$2,435 area, where the 50-day EMA and the SuperTrend indicator cluster. A break below this zone would expose deeper support at the 100-day EMA around $2,265, followed closely by the 200-day EMA at approximately $2,261. As long as the pair holds above this stacked EMA base, the broader uptrend remains intact and pullbacks are likely corrective, while the lack of nearby mapped resistance leaves room for further gains, though slowing momentum suggests advances could become more gradual.
As for XRP, the token remains under pressure, edging lower below $1.50. Despite the correction, the broader structure retains a constructive bullish bias as price holds well above the short, medium and long-term EMAs. The stacked EMA configuration on the daily chart hints at a supportive underlying trend, while the SuperTrend line around $1.28 remains a distant bullish trailing floor.
Momentum indicators back the upside tone, with the RSI near 55 avoiding overbought territory and the MACD hovering slightly above zero, suggesting positive but not overstretched directional pressure.
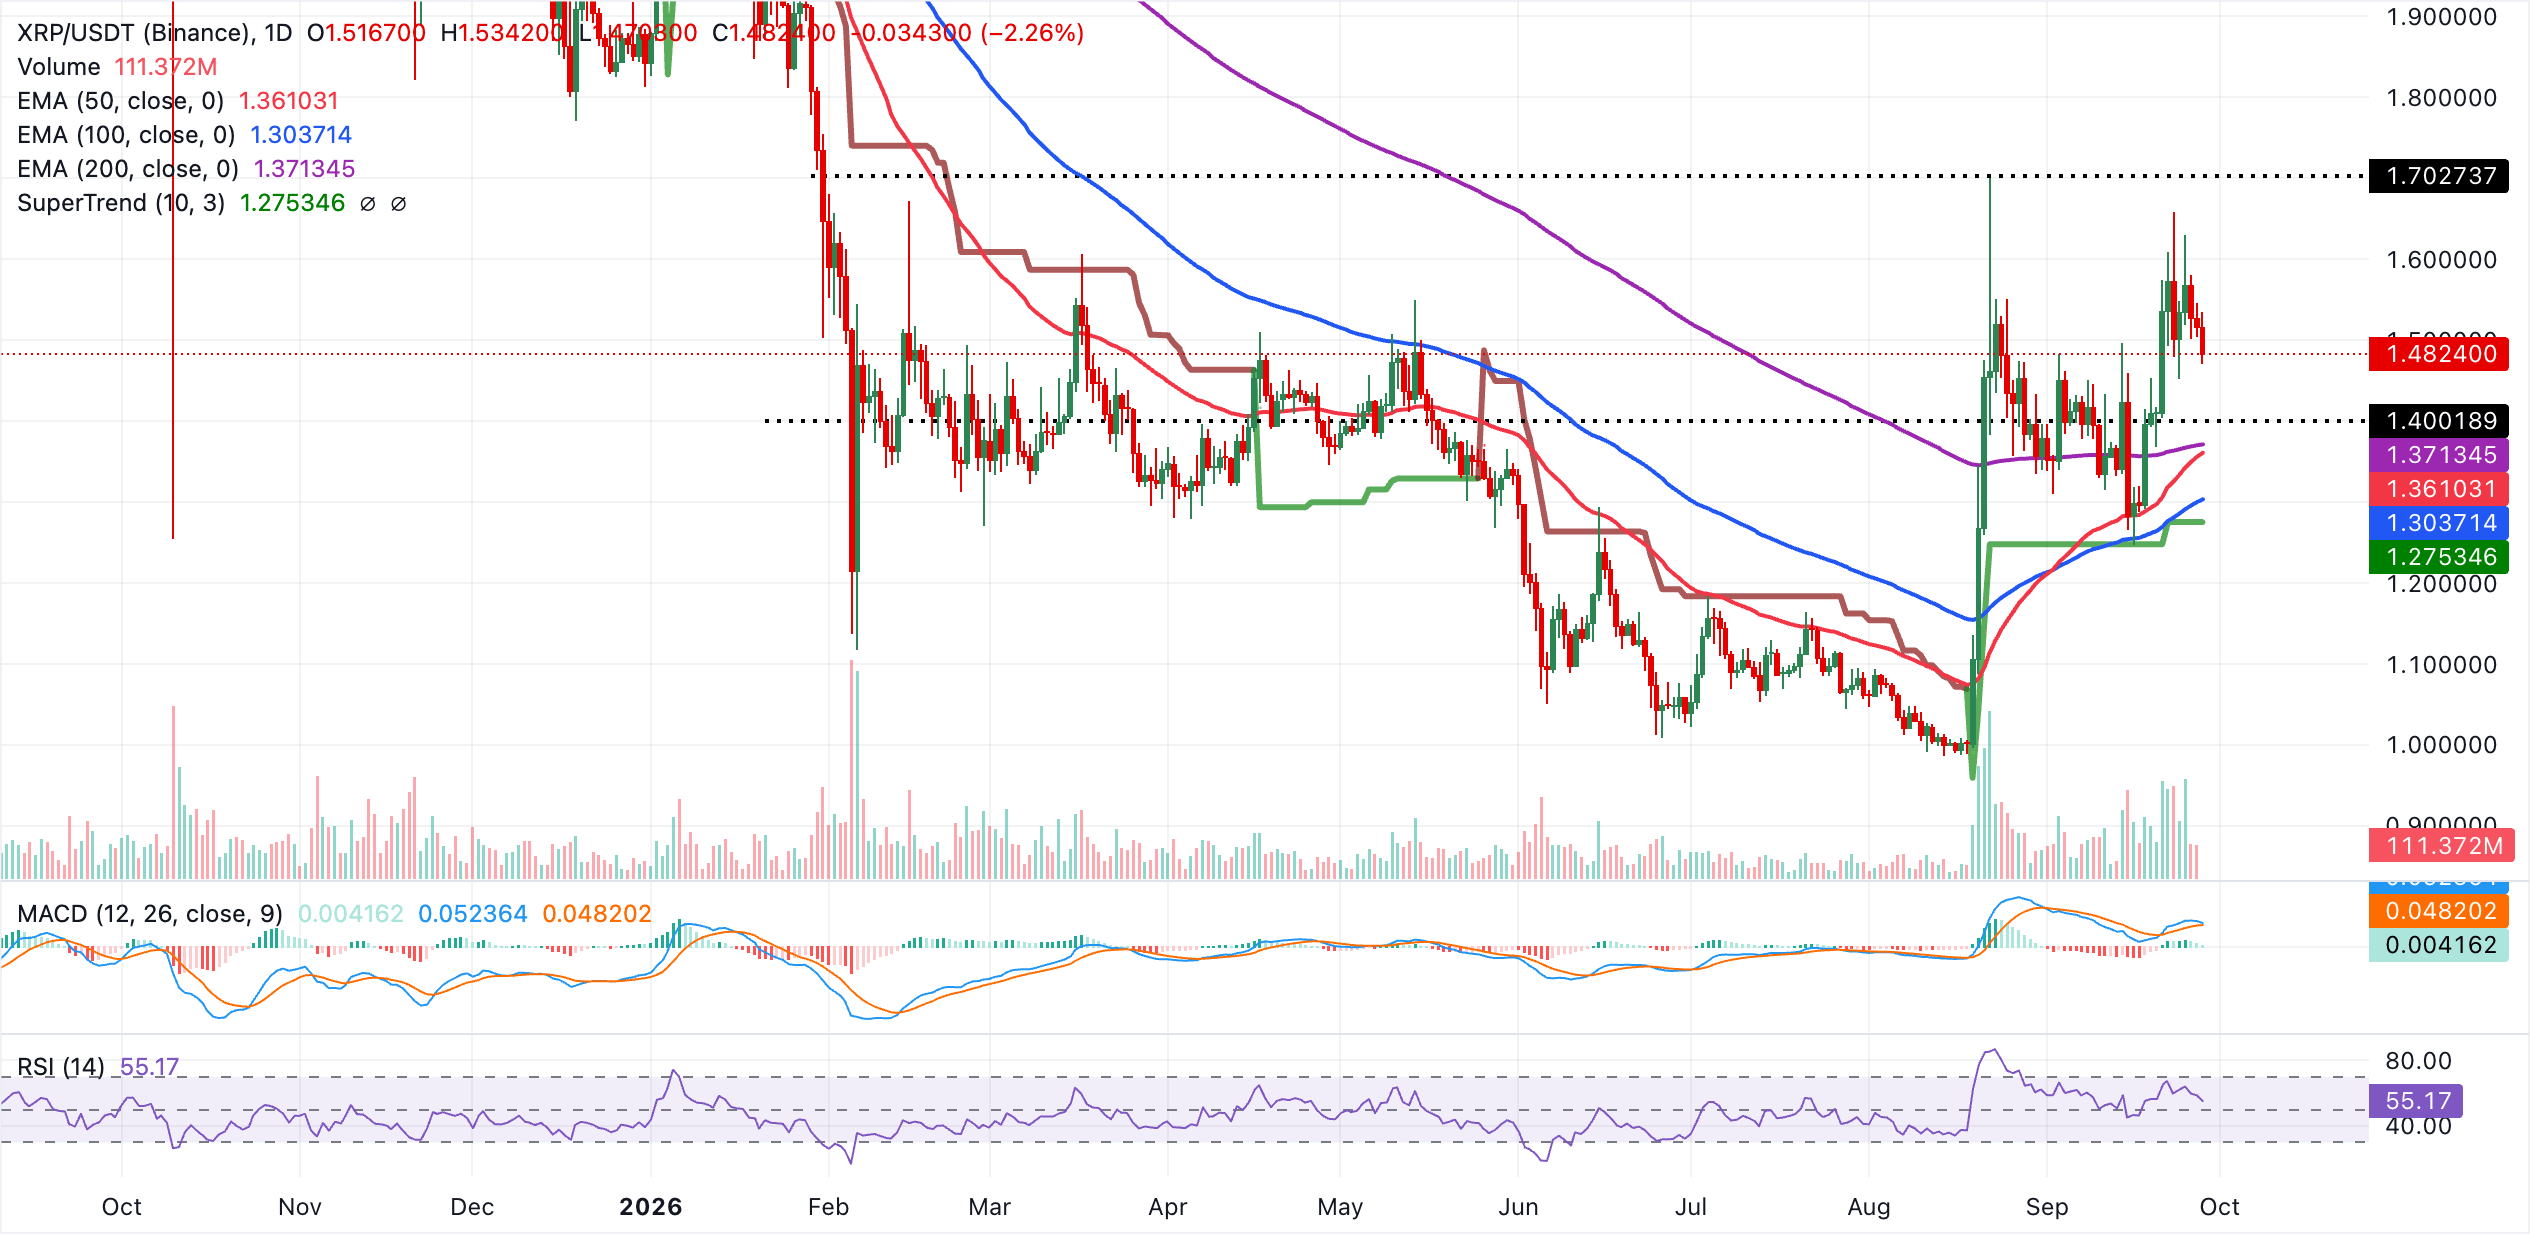
Immediate technical support is reinforced first by the 200-day EMA at $1.37, closely followed by the 50-day EMA at $1.36, which together form a nearby demand band that could attract dip-buying if price retreats. Below that, the 100-day EMA at $1.30 and the SuperTrend support at $1.28 mark deeper pullback zones that would need to hold to preserve the broader bullish structure in the days ahead.
(The technical analysis of this story was written with the help of an AI tool. Know more.)
Open Interest, funding rate FAQs
Higher Open Interest is associated with higher liquidity and new capital inflow to the market. This is considered the equivalent of increase in efficiency and the ongoing trend continues. When Open Interest decreases, it is considered a sign of liquidation in the market, investors are leaving and the overall demand for an asset is on a decline, fueling a bearish sentiment among investors.
Funding fees bridge the difference between spot prices and prices of futures contracts of an asset by increasing liquidation risks faced by traders. A consistently high and positive funding rate implies there is a bullish sentiment among market participants and there is an expectation of a price hike. A consistently negative funding rate for an asset implies a bearish sentiment, indicating that traders expect the cryptocurrency’s price to fall and a bearish trend reversal is likely to occur.
인기 기사
1US Dollar: Support from yields and growth – BBH2WTI Oil extends gains above $94.50 as Trump rejects Hormuz reopening plan3Crypto Today: Bitcoin, Ethereum and XRP edge lower despite strong institutional buying4BoE’s Ramsden warns upside inflation risks may spur rate hikes5USD/JPY: Intervention risk caps upside – BBH6US Dollar Index: Strongest G10 currency performance – Deutsche Bank7EUR/USD: Consensus shifts lower on Dollar resilience – Societe Generale8S&P 500: Equities resilient despite rates selloff – Deutsche Bank9Euro consolidates losses below 1.1400 amid higher Oil prices, risk-off markets


TECHNICAL에 대한 모든 것
트레이딩의 시장 구조: 완벽 가이드 (상승장, 하락장, 횡보장)
캐릭터 변화 (CHoCH): 정의, 예시 및 전략
다크 클라우드 커버 패턴이란 무엇이며, 이를 어떻게 트레이딩하나요?
피어싱 라인 캔들스틱 패턴이란 무엇이며, 이를 어떻게 트레이딩하나요?
트위저 탑 및 바닥 캔들스틱 패턴이란 무엇인가요?
인사이드 바 캔들스틱 패턴: 개념, 식별 방법, 그리고 트레이딩 활용법
교수형 캔들스틱 패턴: 식별 방법과 트레이딩 전략
VWMA와 VWAP: 주요 차이점, 계산식 및 어떤 지표를 사용해야 할까
거래량 가중 평균 가격(VWAP)이란 무엇인가요? 공식, 설정 및 전략

소셜 미디어












이 웹사이트에 제공된 정보는 일반적인 성격의 정보일 뿐이며 개인 맞춤형 금융 자문을 구성하지 않습니다. 이 웹사이트의 정보를 바탕으로 행동하기 전에, 귀하의 목표, 재정 상황 및 필요에 비추어 해당 정보의 적합성을 고려해야 합니다. CFD 및 FX 마진 계약에 대한 투자는 상당한 위험을 수반하며 모든 투자자에게 적합하지 않을 수 있습니다. 귀하는 최초 예치금보다 더 큰 손실을 입을 수 있습니다. 귀하는 기초자산에 대한 소유권이나 어떠한 이해관계도 보유하지 않습니다. 거래를 시작하기 전에 독립적인 자문을 구하고 관련 위험을 충분히 이해하시기를 권장합니다. 웹사이트에 기재된 상품을 취득하기 전에 공시 문서를 읽고 검토하는 것이 중요합니다. 이 웹사이트에서 제공되는 정보 및 광고는 그러한 사용이 현지 법률 및 규정에 위배되는 국가 또는 관할권의 개인이 사용하도록 의도된 것이 아닙니다. 이 웹사이트에서 제공되는 상품 및 서비스는 미국, 말레이시아 및 태국 거주자를 대상으로 하지 않습니다.
TMGM은 다양한 관할권에서 승인 및 규제를 받고 있습니다.
TMGM으로 거래하는 Trademax Australia Limited는 호주 증권투자위원회(ASIC)의 규제를 받으며, AFSL 번호 436416이고 Level 28, One International Tower, 100 Barangaroo Avenue, 2000 Sydney, NSW Australia에 위치하고 있습니다.
이메일: support@tmgm.com.au
TMGM으로 거래하는 Trademax Global Limited는 바누아투 금융서비스위원회(VFSC)의 승인 및 규제를 받으며, 등록 번호 40356이고 1276, Kumul Highway, Port Vila, Vanuatu, Republic of Vanuatu에 등록되어 있습니다.
이메일: support@tmgm.com
Trademax Global Markets (SE) Limited(이하 TMGM)는 세이셸 금융청(FSA)의 인가 및 규제를 받으며, 허가 번호는 SD224입니다. 회사는 세이셸 마헤, 프로비던스 에스테이트 ABIS 센터, 사무실 번호 13에 등록되어 있습니다.
이메일: support@tmgm.com
TMGM으로 거래하는 Trademax Global Markets (International) Pty Ltd는 모리셔스 금융서비스위원회(FSC)의 승인 및 규제를 받으며 라이선스 번호 GB22201012이고, 33, Edith Cavell Street C/o IQ EQ Fund Services (Mauritius) Ltd Port Louis, 11324 Mauritius에 등록되어 있습니다.
이메일: support@tmgm.com
Copyright © TMGM. All rights reserved