

EUR/USD Price Forecast: Bears crack 100-day SMA, eye 1.1500
- EUR/USD breaks 100-day SMA as sellers regain momentum.
- Bearish RSI points lower while 50-day SMA guards downside.
- Break below 1.1500 exposes 1.1450 and 1.1353 next.
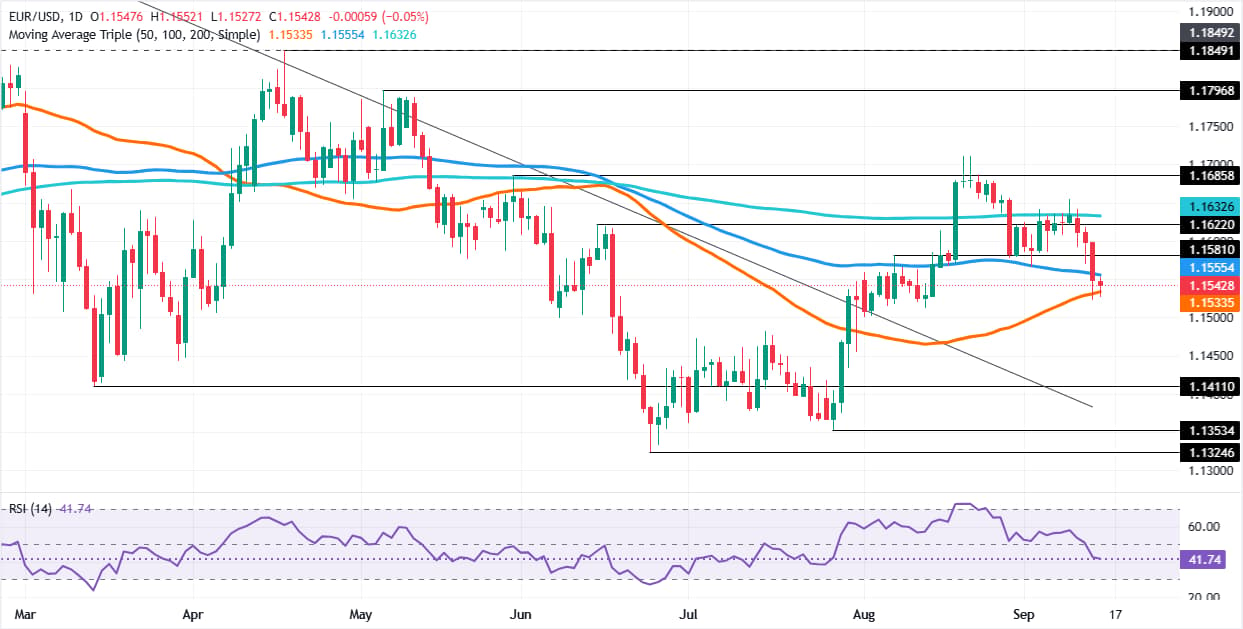
The Euro extends its losses against the US Dollar, sliding below the 100-day Simple Moving Average (SMA) at 1.1555, opening the door to further downside, with sellers setting their sights on Monday’s low of 1.1523. The EUR/USD trades at 1.1548, slightly above the 50-day SMA of 1.1530.
EUR/USD Price Forecast: Technical Outlook
The pair seems poised to consolidate in the short-term, finding support at the 50-day SMA, but the rally was capped by the 100-day SMA. Momentum, as measured by the Relative Strength Index (RSI), is bearish and trending lower, indicating that sellers are strengthening.

If the EUR/USD dives below the 50-day SMA, it opens the door to challenge 1.1500. A breach of the latter will expose the 1.1450 psychological milestone and the July 28 swing low at 1.1353. On further weakness. The year-to-date (YTD) high is up next at 1.1324.
On the other hand, if EUR/USD is set for a recovery, buyers must reclaim the 100-day SMA at 1.1555. On further strength, the next area of interest is 1.1600, immediately followed by the 200-day SMA at 1.1632 and by 1.1650.
EUR/USD Price Chart – Daily
Euro Price Today
The table below shows the percentage change of Euro (EUR) against listed major currencies today. Euro was the strongest against the Japanese Yen.
| USD | EUR | GBP | JPY | CAD | AUD | NZD | CHF | |
|---|---|---|---|---|---|---|---|---|
| USD | 0.05% | 0.14% | 0.50% | 0.10% | 0.12% | 0.37% | 0.15% | |
| EUR | -0.05% | 0.09% | 0.41% | 0.05% | 0.06% | 0.31% | 0.10% | |
| GBP | -0.14% | -0.09% | 0.33% | -0.06% | -0.03% | 0.19% | 0.00% | |
| JPY | -0.50% | -0.41% | -0.33% | -0.38% | -0.37% | -0.13% | -0.33% | |
| CAD | -0.10% | -0.05% | 0.06% | 0.38% | 0.01% | 0.26% | 0.05% | |
| AUD | -0.12% | -0.06% | 0.03% | 0.37% | -0.01% | 0.24% | 0.02% | |
| NZD | -0.37% | -0.31% | -0.19% | 0.13% | -0.26% | -0.24% | -0.20% | |
| CHF | -0.15% | -0.10% | -0.00% | 0.33% | -0.05% | -0.02% | 0.20% |
The heat map shows percentage changes of major currencies against each other. The base currency is picked from the left column, while the quote currency is picked from the top row. For example, if you pick the Euro from the left column and move along the horizontal line to the US Dollar, the percentage change displayed in the box will represent EUR (base)/USD (quote).














