

Trading
Explora una amplia gama de mercados con precios competitivos, liquidez profunda y herramientas de trading avanzadas.
Más información 
Plataforma
Opera sin interrupciones con la potente plataforma de TMGM, diseñada para ofrecer velocidad, precisión y una experiencia de trading superior.
Más información Plataforma de trading
Herramientas de trading
Academia
Aprende los fundamentos del trading con recursos ideales para principiantes, incluidas guías, seminarios web y análisis del mercado.
Más información Academia TMGM
Noticias y análisis
Obtén actualizaciones del mercado en tiempo real y análisis de expertos para adelantarte a las oportunidades de trading
Más información Noticias y análisis
Acerca de
Descubre qué distingue a TMGM: nuestra presencia global, solidez regulatoria y compromiso con la innovación en el trading.
Más información Por qué elegir TMGM
GBP/JPY Price Forecast: Doji tests bulls’ resolve below 212.00
- GBP/JPY consolidates near 211.77 as doji signals growing buyer indecision.
- Bullish RSI supports recovery, but 212.00 resistance limits further gains.
- Break above 212.00 exposes 200-day SMA at 212.98 and 213.43.
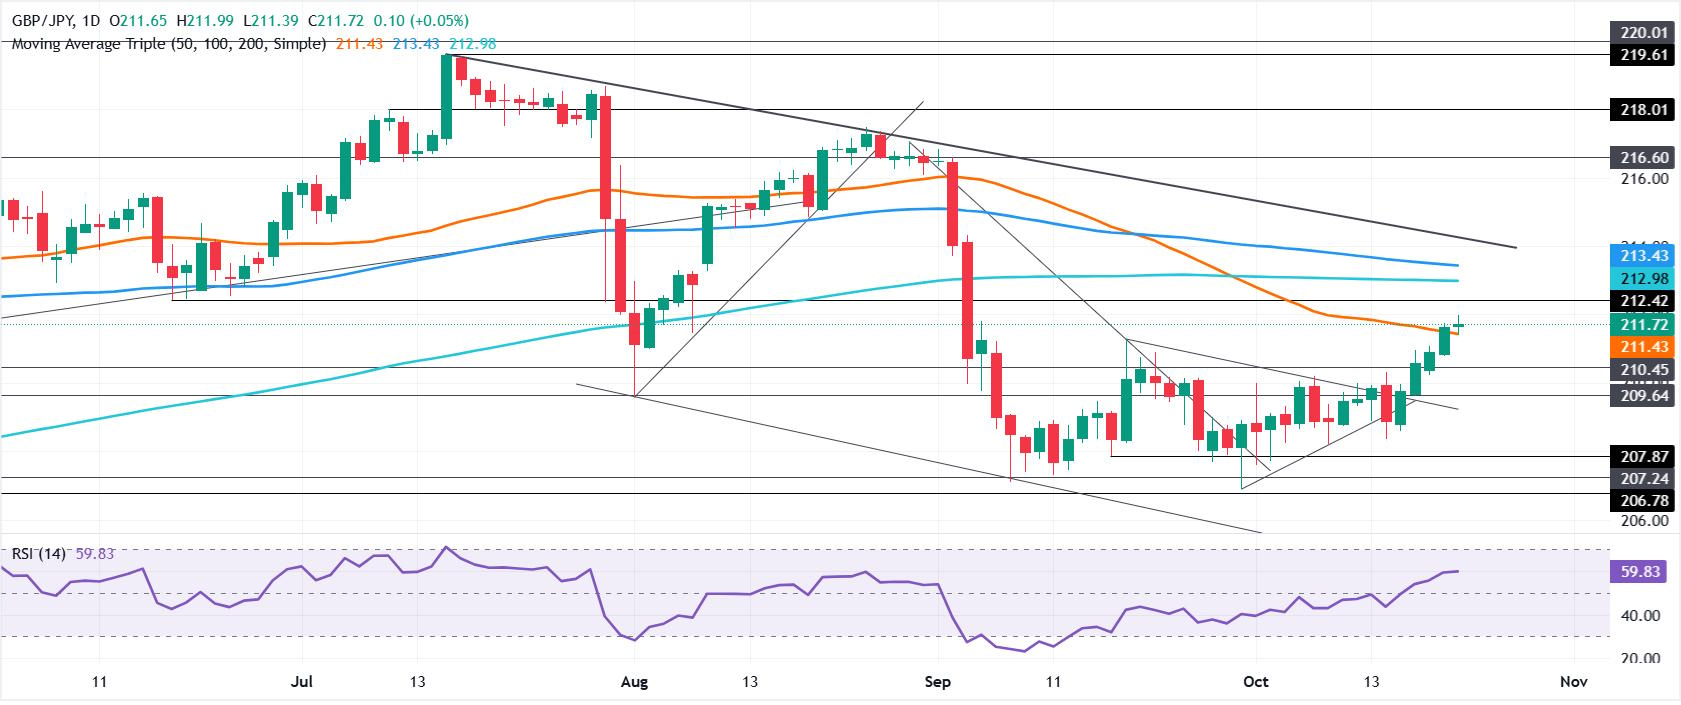
GBP/JPY goes nowhere on Wednesday, trading around 211.77 as neither buyers nor sellers can provide direction, following the break of the 50-day Simple Moving Average (SMA) at 211.34 towards the close of the October 20 session.
GBP/JPY Price Forecast: Technical outlook
The GBP/JPY has extended its gains for six days, yet the formation of a ‘doji’ suggests that the uptrend remains fragile as key resistance levels emerge above the 212.00 figure.

The Relative Strength Index (RSI) indicates bullish momentum, while price action shows buyers' hesitation to lift the price above the 212.00 milestone.
In that case, the next key resistance would be the 200-day SMA at 212.98, followed by the 100-day SMA at 213.43. On further strength, the next stop is 214.00.
In a bearish scenario, GBP/JPY needs to drop below the 50-day SMA, which could expose the 211.00 mark. A breach of the latter will expose 210.00, followed by the October 8 swing low of 208.20, followed by the September 30 cycle low of 206.89.
GBP/JPY Price Chart – Daily
Japanese Yen Price Today
The table below shows the percentage change of Japanese Yen (JPY) against listed major currencies today. Japanese Yen was the strongest against the Euro.
| USD | EUR | GBP | JPY | CAD | AUD | NZD | CHF | |
|---|---|---|---|---|---|---|---|---|
| USD | -0.00% | -0.07% | -0.06% | -0.08% | -0.39% | -0.10% | -0.04% | |
| EUR | 0.00% | -0.14% | -0.07% | -0.12% | -0.32% | -0.14% | -0.08% | |
| GBP | 0.07% | 0.14% | 0.06% | 0.00% | -0.19% | -0.01% | 0.06% | |
| JPY | 0.06% | 0.07% | -0.06% | -0.04% | -0.24% | -0.07% | 0.00% | |
| CAD | 0.08% | 0.12% | -0.01% | 0.04% | -0.21% | -0.02% | 0.04% | |
| AUD | 0.39% | 0.32% | 0.19% | 0.24% | 0.21% | 0.19% | 0.25% | |
| NZD | 0.10% | 0.14% | 0.00% | 0.07% | 0.02% | -0.19% | 0.06% | |
| CHF | 0.04% | 0.08% | -0.06% | -0.00% | -0.04% | -0.25% | -0.06% |
The heat map shows percentage changes of major currencies against each other. The base currency is picked from the left column, while the quote currency is picked from the top row. For example, if you pick the Japanese Yen from the left column and move along the horizontal line to the US Dollar, the percentage change displayed in the box will represent JPY (base)/USD (quote).
Artículos destacados
1El euro afronta primero los PMI y, durante el fin de semana, la calificación crediticia de Francia2El dólar australiano resiste el nerviosismo por la guerra en Irán mientras se duplican las apuestas por una subida de tipos del RBA3La libra esterlina afronta los datos de ventas minoristas con la subida de tipos de noviembre ya descontada4La inflación del IPC de Nueva Zelanda se modera al 3,7 % interanual en el tercer trimestre, frente al 3,8 % previsto5Rupia indonesia: sesgo de depreciación ante el riesgo relacionado con MSCI – MUFG6Won surcoreano: crece el riesgo de caídas hacia los 1400 frente al dólar estadounidense – TD Securities7Previsión del precio de DOGE: se lanza Dogecoin Labs, con una resistencia en el horizonte8El dólar neozelandés mantiene su racha alcista de cara al informe de inflación9Dólar taiwanés: exportaciones sólidas, pero la divisa sigue bajo presión – Commerzbank


¡Comience ahora!
Regístrese y acceda a los mercados globales en menos de 3 minutos

Conéctese con nosotros









Contactos
Teléfono: +61 2 8036 8388
Fax: +61 2 8036 8388
Correo electrónico: support@tmgm.com



La información proporcionada en este sitio web es únicamente de carácter general y no constituye asesoramiento financiero personal. Antes de actuar sobre cualquier información de este sitio web, debe considerar la idoneidad de la información en relación con sus objetivos, situación financiera y necesidades. Invertir en CFD y contratos de margen de FX conlleva riesgos significativos y no es adecuado para todos los inversores. Puede perder más que su depósito inicial. Usted no posee ni tiene ningún interés en el activo subyacente. Le recomendamos que busque asesoramiento independiente y se asegure de comprender plenamente los riesgos involucrados antes de operar. Es importante que lea y considere el documento de divulgación antes de adquirir cualquier producto listado en el sitio web. La información y los anuncios ofrecidos en este sitio web no están destinados al uso por parte de ninguna persona en ningún país o jurisdicción donde dicho uso sea contrario a las leyes y regulaciones locales. Los productos y servicios ofrecidos en este sitio web no están destinados a residentes de Estados Unidos, Malasia y Tailandia.
TMGM está autorizado y regulado en varias jurisdicciones.
Trademax Australia Limited, que opera como TMGM, está regulada por la Comisión Australiana de Valores e Inversiones (ASIC), AFSL n.º 436416, y está ubicada en Level 28, One International Tower, 100 Barangaroo Avenue, 2000 Sydney, NSW Australia.
Correo electrónico: support@tmgm.com.au
Trademax Global Limited, que opera como TMGM, está autorizada y regulada por la Comisión de Servicios Financieros de Vanuatu (VFSC), número de registro 40356, y está registrada en 1276, Kumul Highway, Port Vila, Vanuatu, República de Vanuatu.
Correo electrónico: support@tmgm.com
Trademax Global Markets (SE) Limited, que opera como TMGM, está autorizada y regulada por la Autoridad de Servicios Financieros (FSA) de Seychelles, con número de licencia SD224. La empresa está registrada en Office No 13, Providence Estate ABIS Centre, Mahe, Seychelles.
Correo electrónico: support@tmgm.com
Trademax Global Markets (International) Pty Ltd, que opera como TMGM, está autorizada y regulada por la Comisión de Servicios Financieros de Mauricio (FSC) con licencia n.º GB22201012, y está registrada en 33, Edith Cavell Street C/o IQ EQ Fund Services (Mauritius) Ltd Port Louis, 11324 Mauricio.
Correo electrónico: support@tmgm.com
Copyright © TMGM. Todos los derechos reservados