

Trading
Explore a wide range of markets with competitive pricing, deep liquidity, and advanced trading tools.
Learn More 
Platform
Trade seamlessly with TMGM's powerful platform, built for speed, precision, and a superior trading experience.
Learn More Trading Platform
Academy
Learn the fundamentals of trading with beginner-friendly resources, including guides, webinars, and market insights.
Learn More News & Analysis
Get real-time market updates and expert analysis to stay ahead of trading opportunities
Learn More News & Analysis
About
Learn what sets TMGM apart — our global presence, regulatory strength, and commitment to innovation in trading.
Learn More Why Choose TMGM
Sponsorship
US Dollar Index Price Forecast: How is safe-haven demand supporting a recovery above the 20-day EMA ahead of US NFP?
- Safe-haven demand fuelled by the AI rout lifts the US Dollar Index towards 101.95.
- October’s US NFP release, due at 13:30 GMT, is firmly in investors’ focus.
- Expectations for the Fed’s monetary policy are unlikely to change significantly following the US NFP figures.
Stronger demand for safe-haven assets is driving a sharp rise in the US Dollar (USD) against its major currency peers. An intensifying sell-off in Artificial Intelligence (AI) infrastructure stocks has triggered global sector rotation, supporting the shift towards safety.

At the time of writing, a 0.35% gain takes the US Dollar Index (DXY) to around 101.95. The index tracks the Greenback against six major currencies.
How Is The US Dollar Performing Today?
The US Dollar recorded its strongest performance against the Australian Dollar today. The table below sets out the percentage changes in the US Dollar (USD) against the major currencies listed.
| USD | EUR | GBP | JPY | CAD | AUD | NZD | CHF | |
|---|---|---|---|---|---|---|---|---|
| USD | 0.29% | 0.34% | 0.05% | 0.38% | 0.81% | 0.75% | 0.04% | |
| EUR | -0.29% | 0.04% | -0.26% | 0.09% | 0.52% | 0.45% | -0.25% | |
| GBP | -0.34% | -0.04% | -0.30% | 0.05% | 0.48% | 0.40% | -0.30% | |
| JPY | -0.05% | 0.26% | 0.30% | 0.35% | 0.78% | 0.70% | 0.00% | |
| CAD | -0.38% | -0.09% | -0.05% | -0.35% | 0.42% | 0.35% | -0.35% | |
| AUD | -0.81% | -0.52% | -0.48% | -0.78% | -0.42% | -0.08% | -0.77% | |
| NZD | -0.75% | -0.45% | -0.40% | -0.70% | -0.35% | 0.08% | -0.69% | |
| CHF | -0.04% | 0.25% | 0.30% | -0.01% | 0.35% | 0.77% | 0.69% |
Percentage movements between the major currencies are displayed in the heat map. Select the base currency in the left-hand column and the quote currency in the top row. For instance, choosing the US Dollar on the left and following that row across to the Japanese Yen gives the percentage change for USD (base)/JPY (quote) in the corresponding cell.
Why are defensives outperforming as the AI unwind hits US equities?
Selling has extended well beyond technology stocks, with Danske Bank strategists saying the recent “AI unwind escalated into an outright rout yesterday and took the whole US market with it,”. To illustrate the scale of the losses, they note that “the S&P 500 fell 4.4%, with every sector lower and IT leading the declines, while the Nasdaq Composite lost 5.5% and the Nasdaq 100 6.4%, its worst session since March 2020.” Danske also stresses that “defensives held up far better, so this was rotation within equities as much as money leaving them,” indicating a substantial change in sector positioning rather than an indiscriminate withdrawal from risk assets.
Attention on the economic calendar centres on October’s United States (US) Nonfarm Payrolls (NFP) report, due at 13:30 GMT and keenly awaited by investors.
Estimates point to 65K new hires by US employers, up from September’s 29K, while the Unemployment Rate is expected to remain unchanged at 4.2%.
Wage growth, as measured by Average Hourly Earnings, is forecast to moderate to 2.9% Year-on-year (YoY) from 3% in September. The monthly increase, however, is projected at 0.3%, compared with the previous reading of 0.1%.
Why is the Dollar’s response to jobs data becoming less predictable?
A clear directional response to labour figures is no longer evident in the US currency, according to Commerzbank. The bank notes that recent payroll reports have prompted increasingly subdued and uneven moves in foreign exchange markets. In its words, “the US dollar does not seem entirely sure how to react to the labour market figures,” leading it to suggest that, “barring any major surprises, we might be in for a fairly relaxed end to the week.”
US Dollar Index Technical Analysis: Can The Bullish Bias Hold?
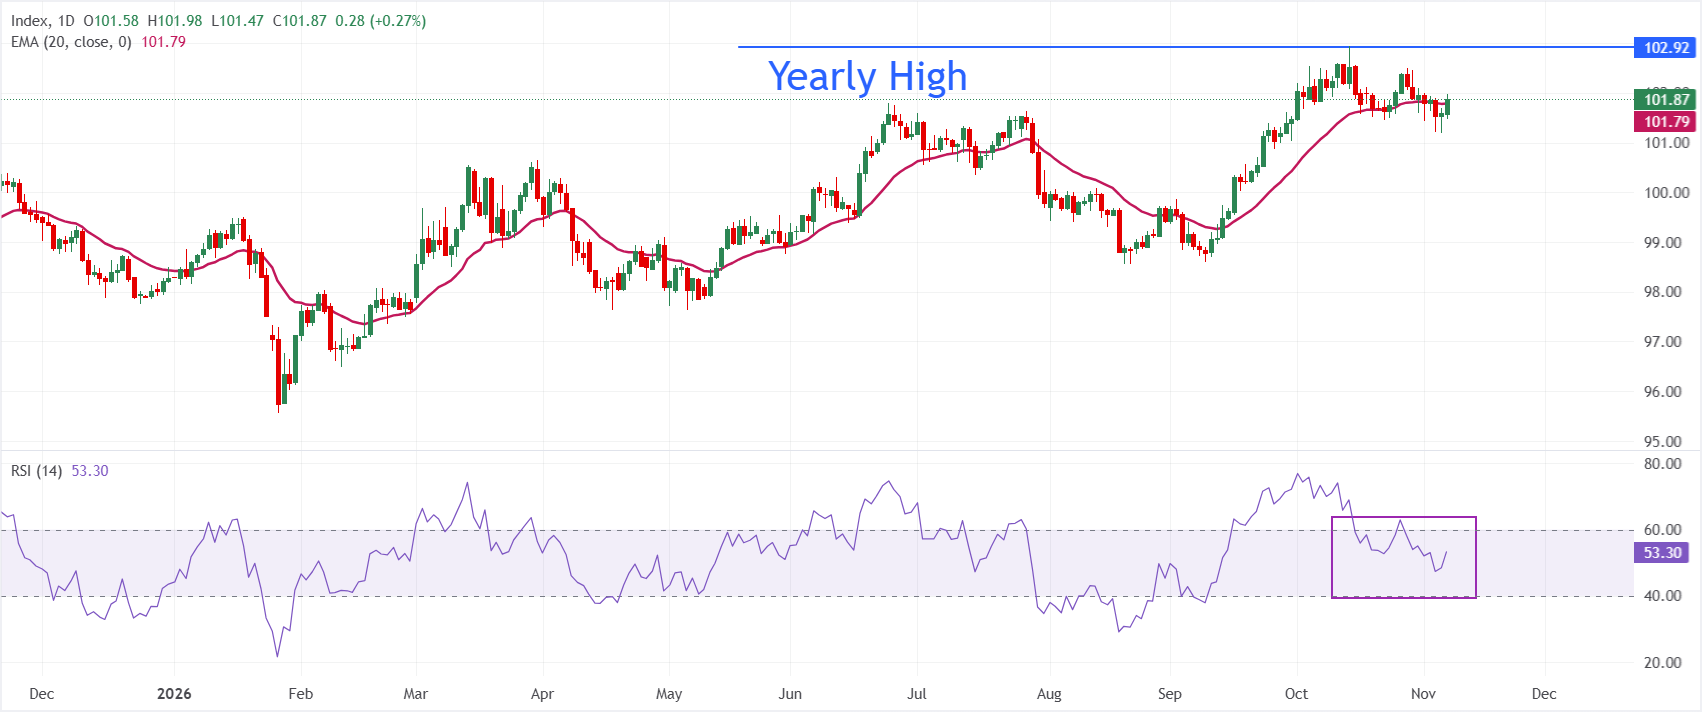
Holding above the 20-day exponential moving average (EMA) of 101.79 gives Dollar Index Spot a mildly bullish near-term bias, with the daily chart showing a price of 101.86. This positioning points to underlying buying interest following the recent consolidation. Meanwhile, a Relative Strength Index (RSI) reading of 53.26 remains neutral, indicating positive momentum without signs of overextension.
The 20-day EMA around 101.79 offers the first downside support. Close by, the session’s opening level near 101.86 serves as a pivot that must hold to maintain the positive tone. A sustained move beneath this support zone would suggest weakening buying pressure and leave scope for a deeper correction towards the recent lows around 101.00. On the upside, a sustained hold above the 20-day EMA is needed for the pair to revisit the yearly high near 103.00.
(The technical analysis of this story was written with the help of an AI tool. Know more.)
POPULAR ARTICLES
1US Dollar Index Price Forecast: How is safe-haven demand supporting a recovery above the 20-day EMA ahead of US NFP?2Why is the Euro wavering in a range against the British Pound despite upbeat German factory data?3Czech Koruna: Is range-bound trading against the Euro set to continue? – ING4USD/JPY Price Forecast: Are traders holding back below 158.00 as US NFP approaches?5Austria Wholesale Prices n.s.a (MoM) fell from previous 1.9% to -0.2% in October6Austria Wholesale Prices n.s.a (YoY) fell from previous 10.2% to 10% in October7Switzerland Foreign Currency Reserves above forecasts (0B) in October: Actual (759B)8Japanese Yen: Is the bias bullish within the 157.00–159.00 range against US Dollar? – UOB9Forex Today: US Dollar recovery gains traction as crucial employment data looms

Get Started!
Sign up and access the Global Markets in less than 3 minutes

Connect With Us









Contacts
Phone: +61 2 8036 8388
Fax: +61 2 8036 8388
Email: support@tmgm.com



The information provided on this website is of a general nature only and does not constitute personal financial advice. Before acting on any information on this website, you should consider the suitability of the information in relation to your objectives, financial situation and needs. Investing in CFDs and FX Margin Contracts carries significant risks and is not suitable for all investors. You may lose more than your initial deposit. You do not own, or have, any interest in the underlying asset. We recommend that you seek independent advice and ensure you fully understand the risks involved before trading. It is important that you read and consider the disclosure document before you acquire any product listed on the website. The information and advertisements offered on this website are not intended for use by any person in any country or jurisdiction where such use would be contrary to local laws and regulations. The Products and Services offered on this website are not intended for residents of the United States, Malaysia and Thailand.
TMGM is authorized and regulated in various jurisdictions.
Trademax Australia Limited, trading as TMGM, is regulated by the Australian Securities and Investments Commission (ASIC), AFSL no. 436416 and is located at Level 28, One International Tower, 100 Barangaroo Avenue, 2000 Sydney, NSW Australia.
Email: support@tmgm.com.au
Trademax Global Limited, trading as TMGM, is authorized and regulated by the Vanuatu Financial Services Commission (VFSC), registration number 40356 and registered at 1276, Kumul Highway, Port Vila, Vanuatu, Republic of Vanuatu.
Email: support@tmgm.com
Trademax Global Markets (SE) Limited, trading as TMGM, is authorized and regulated by the Financial Services Authority (FSA) of Seychelles, with license number SD224. The company is registered at Office No 13, Providence Estate ABIS Centre, Mahe, Seychelles.
Email: support@tmgm.com
Trademax Global Markets (International) Pty Ltd, trading as TMGM, is authorized and regulated by the Financial Services Commission, Mauritius (FSC) with license no. GB22201012, and registered at 33, Edith Cavell Street C/o IQ EQ Fund Services (Mauritius) Ltd Port Louis, 11324 Mauritius.
Email: support@tmgm.com
Copyright © TMGM. All rights reserved