

Trading
Explore a wide range of markets with competitive pricing, deep liquidity, and advanced trading tools.
Learn More 
Platform
Trade seamlessly with TMGM's powerful platform, built for speed, precision, and a superior trading experience.
Learn More Trading Platform
Academy
Learn the fundamentals of trading with beginner-friendly resources, including guides, webinars, and market insights.
Learn More News & Analysis
Get real-time market updates and expert analysis to stay ahead of trading opportunities
Learn More News & Analysis
About
Learn what sets TMGM apart — our global presence, regulatory strength, and commitment to innovation in trading.
Learn More Why Choose TMGM
Sponsorship
Silver Price Forecast: Why do lower highs still weigh on XAG/USD despite its recent rebound?
- Silver's rally loses steam as the US Dollar and Treasury yields rebound following Wednesday's sharp gains in the metal.
- With XAG/USD trading below the Bollinger midline near $55, the broader outlook retains a bearish bias.
- Selling pressure persists as MACD stays negative and ADX remains elevated, despite RSI's recovery from oversold levels.
Silver's (XAG/USD) upward momentum is fading on Thursday as recovering US Dollar (USD) and Treasury yields limit follow-through buying after the previous day's 5.18% surge. Earlier on Thursday, the white metal touched $53.48, its strongest level since October 29, but subsequently retreated to around $52.79 at the time of writing.

Behind Wednesday’s surge was the Democratic sweep of Congress. Traders wagered that a divided government could restrain fiscal expansion and increase pressure on President Donald Trump to end the war with Iran. Widespread US Dollar weakness followed the result. Meanwhile, sharply falling Oil prices reduced inflation worries and contributed to lower Treasury yields, supporting demand for precious metals.
The Greenback nevertheless remains supported by expectations that the Federal Reserve (Fed) will raise interest rates again in December, creating a hurdle for non-yielding assets such as Silver.
Thursday’s US Initial Jobless Claims data came in at 189K, down from 194K and below the expected 196K. The four-week moving average also eased, moving from 196.75K to 194.75K. For further indications of the Fed’s policy direction, market attention now turns to Friday’s US Nonfarm Payrolls (NFP) report.
Can Silver Shake Off Its Bearish Technical Bias?
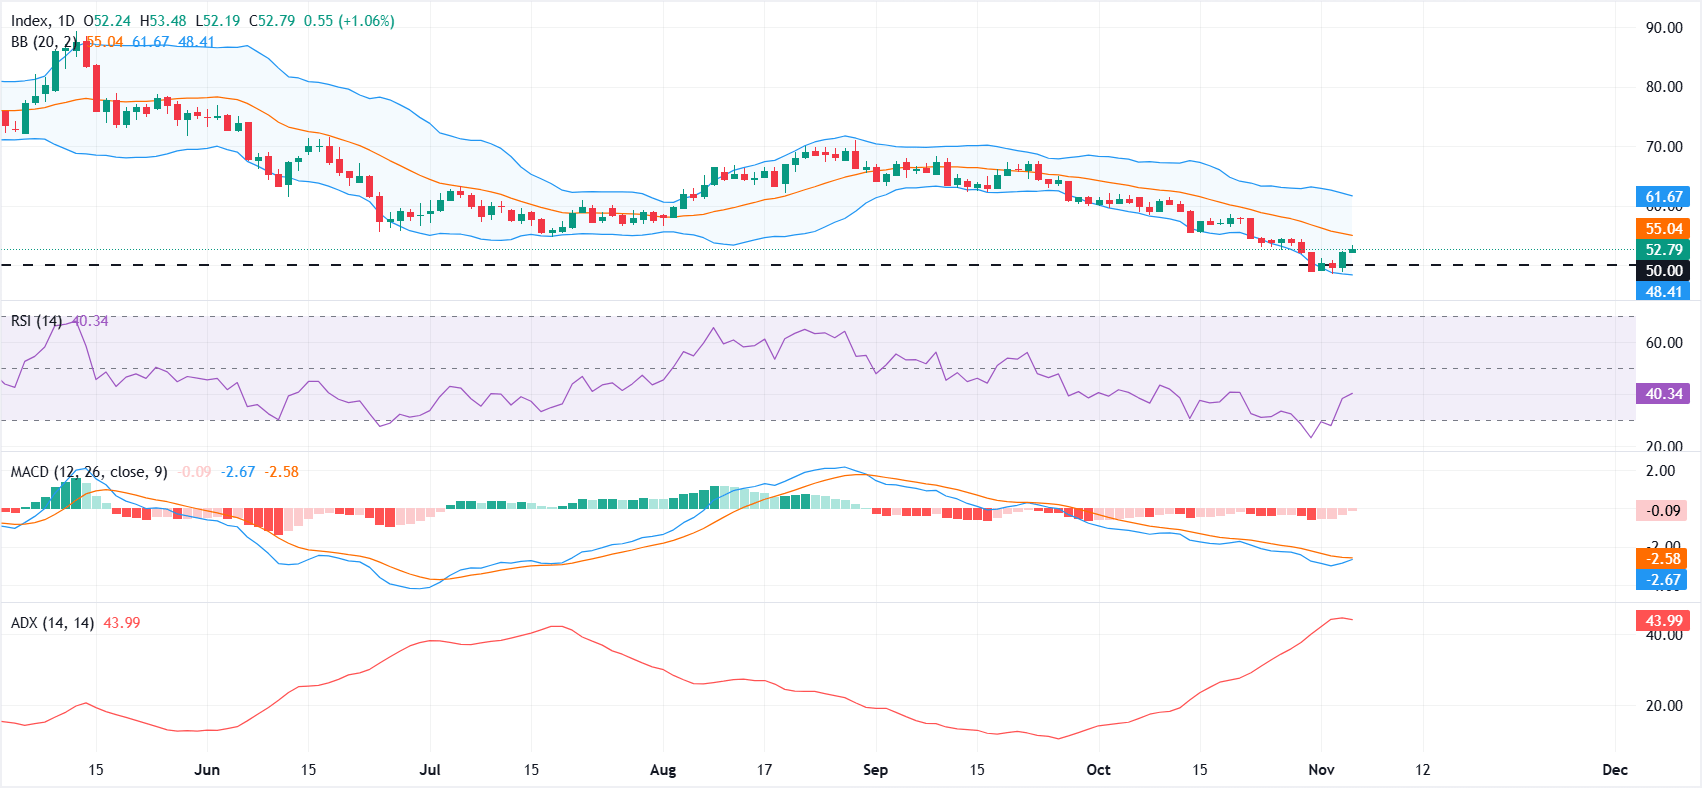
Sellers continue to dominate the daily XAG/USD chart, with a succession of lower highs following the brief peak near $70 in late August. Trading remains confined to the lower half of the Bollinger Bands’ volatility envelope. Silver is below the bands’ 20-period Simple Moving Average (SMA), roughly $55, and substantially beneath upper-band resistance near $61.67.
Despite rebounding from oversold levels to around 40, the Relative Strength Index (RSI) (14) has yet to regain its midline. Moving Average Convergence Divergence (MACD) is also slightly negative, suggesting that downward momentum continues even as selling pressure eases modestly. An Average Directional Index (ADX) reading above 40 reinforces the strength of the prevailing trend.
The horizontal floor around $50.00 offers immediate downside support, followed by the lower Bollinger Band near $48.40. Should the sell-off deepen, volatility support could materialise at that lower band. For a recovery, the first resistance is the Bollinger midline at about $55.04. A sustained move above this hurdle would be needed to clear a path towards upper-band resistance around $61.67, where sellers are likely to regain control.
(The technical analysis of this story was written with the help of an AI tool. Know more.)
POPULAR ARTICLES
1Australian Dollar: Outlook neutral following steep recovery from lows against US Dollar – UOB2Silver: Industrial risks persist as the recovery advances – OCBC3Policy rate remains SNB’s primary tool, says Schlegel4Euro: ECB Rate Hike Prospects Lend Support – Commerzbank5Fed's Hammack backs gradual rate hikes as the best path for policy6Potential security threat prompts Binance to revoke SignalPlus API keys7Silver Price Forecast: Why do lower highs still weigh on XAG/USD despite its recent rebound?8Swedish Krona: Does the inflation setback cast doubt on the Riksbank’s path? – Nomura9Last week saw US Initial Jobless Claims fall to 189K


Get Started!
Sign up and access the Global Markets in less than 3 minutes

Connect With Us









Contacts
Phone: +61 2 8036 8388
Fax: +61 2 8036 8388
Email: support@tmgm.com



The information provided on this website is of a general nature only and does not constitute personal financial advice. Before acting on any information on this website, you should consider the suitability of the information in relation to your objectives, financial situation and needs. Investing in CFDs and FX Margin Contracts carries significant risks and is not suitable for all investors. You may lose more than your initial deposit. You do not own, or have, any interest in the underlying asset. We recommend that you seek independent advice and ensure you fully understand the risks involved before trading. It is important that you read and consider the disclosure document before you acquire any product listed on the website. The information and advertisements offered on this website are not intended for use by any person in any country or jurisdiction where such use would be contrary to local laws and regulations. The Products and Services offered on this website are not intended for residents of the United States, Malaysia and Thailand.
TMGM is authorized and regulated in various jurisdictions.
Trademax Australia Limited, trading as TMGM, is regulated by the Australian Securities and Investments Commission (ASIC), AFSL no. 436416 and is located at Level 28, One International Tower, 100 Barangaroo Avenue, 2000 Sydney, NSW Australia.
Email: support@tmgm.com.au
Trademax Global Limited, trading as TMGM, is authorized and regulated by the Vanuatu Financial Services Commission (VFSC), registration number 40356 and registered at 1276, Kumul Highway, Port Vila, Vanuatu, Republic of Vanuatu.
Email: support@tmgm.com
Trademax Global Markets (SE) Limited, trading as TMGM, is authorized and regulated by the Financial Services Authority (FSA) of Seychelles, with license number SD224. The company is registered at Office No 13, Providence Estate ABIS Centre, Mahe, Seychelles.
Email: support@tmgm.com
Trademax Global Markets (International) Pty Ltd, trading as TMGM, is authorized and regulated by the Financial Services Commission, Mauritius (FSC) with license no. GB22201012, and registered at 33, Edith Cavell Street C/o IQ EQ Fund Services (Mauritius) Ltd Port Louis, 11324 Mauritius.
Email: support@tmgm.com
Copyright © TMGM. All rights reserved