

Trading
Explore a wide range of markets with competitive pricing, deep liquidity, and advanced trading tools.
Learn More 
Platform
Trade seamlessly with TMGM's powerful platform, built for speed, precision, and a superior trading experience.
Learn More Trading Platform
Academy
Learn the fundamentals of trading with beginner-friendly resources, including guides, webinars, and market insights.
Learn More News & Analysis
Get real-time market updates and expert analysis to stay ahead of trading opportunities
Learn More News & Analysis
About
Learn what sets TMGM apart — our global presence, regulatory strength, and commitment to innovation in trading.
Learn More Why Choose TMGM
Sponsorship
Data-centre backlash wipes out the Dow Jones Industrial Average’s midterm rally
- Data-centre backlash wipes out Wednesday's DJIA gains, sending the index to its lowest since 14 October.
- About a third of the points lost come from Goldman Sachs and Caterpillar, compared with roughly 6% from Nvidia.
- Friday's October payrolls release at 13:30 GMT is expected to show 65K, up from September's 29K.
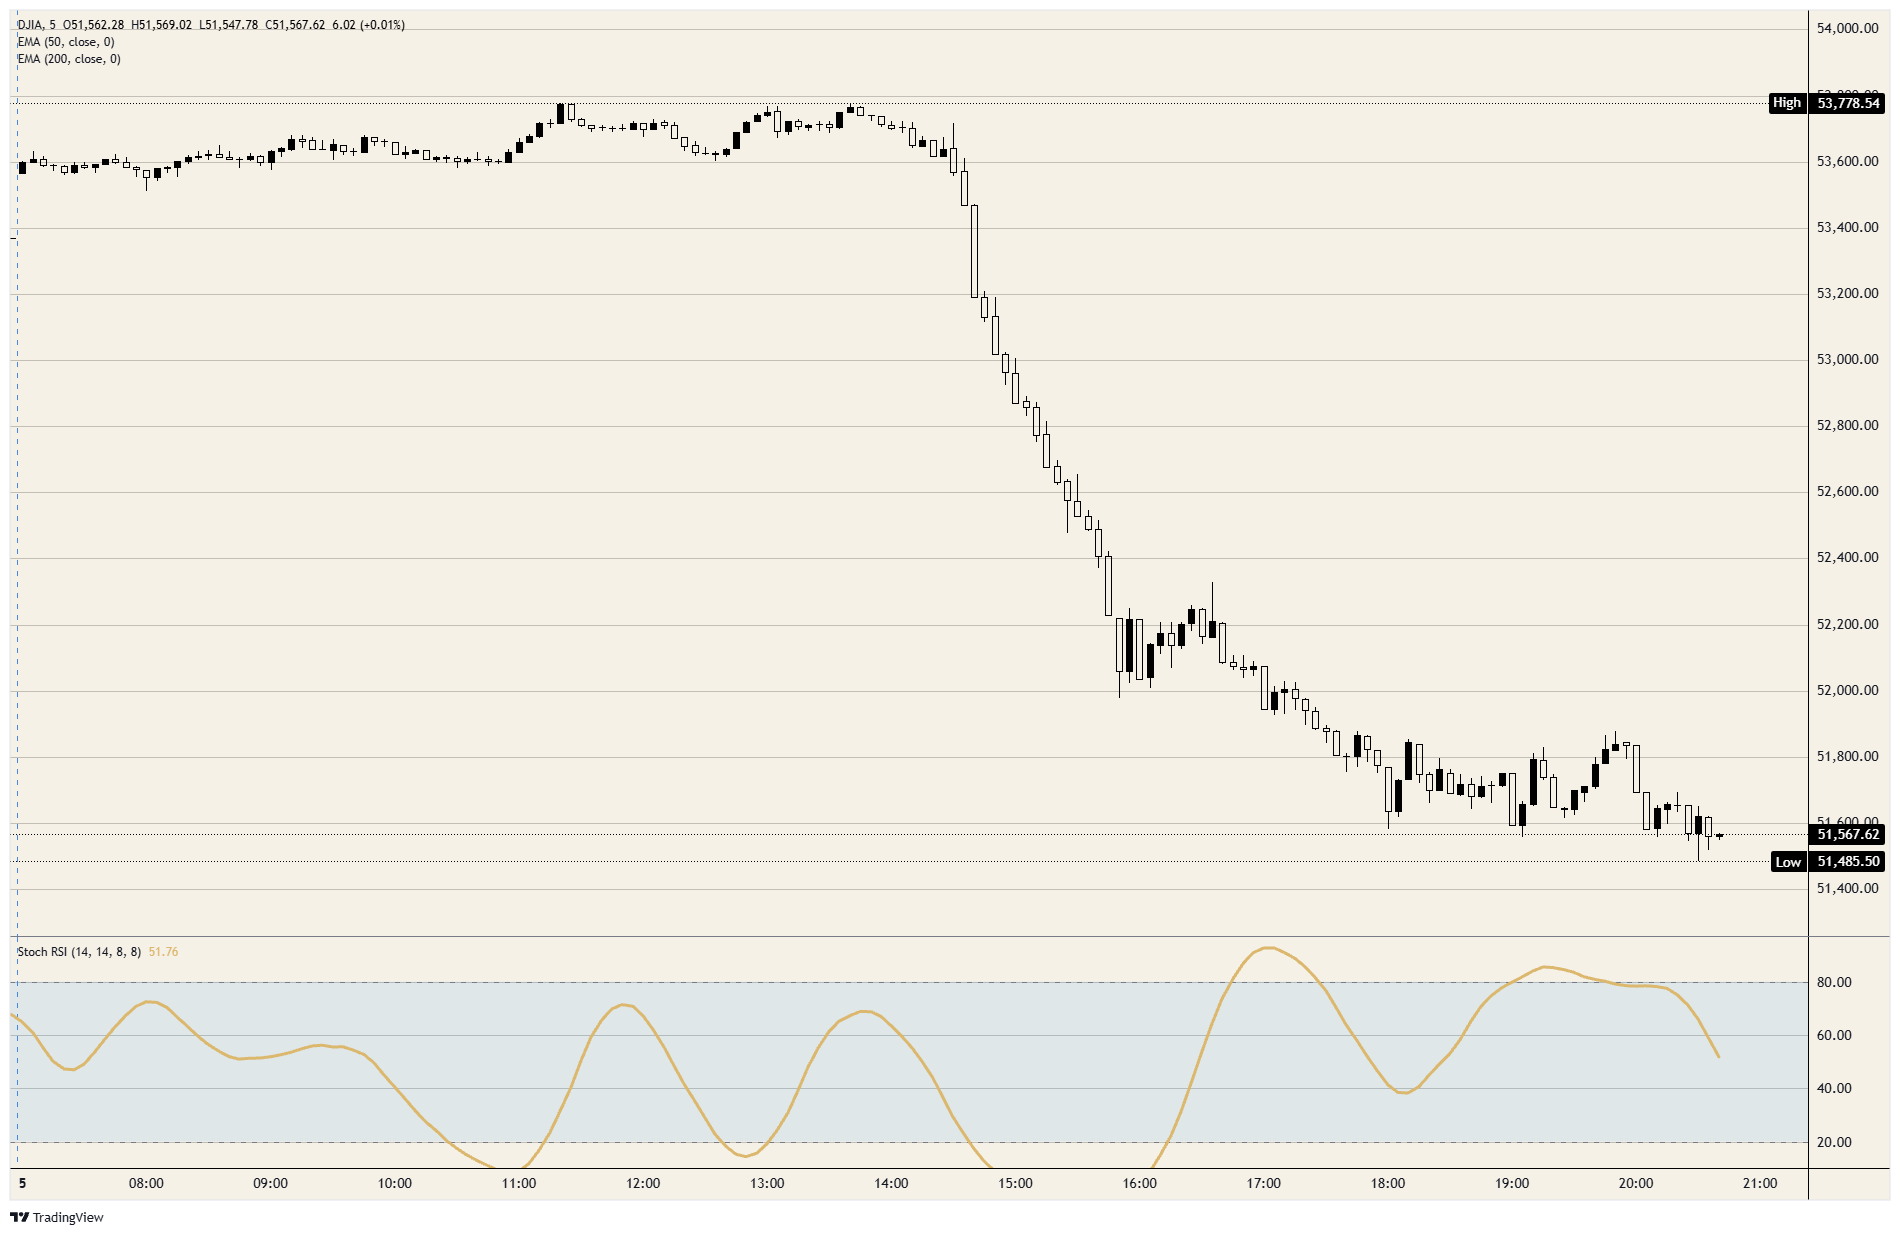
The Dow Jones Industrial Average has surrendered Wednesday's rally, trading just above 51,500, below Tuesday's close and at its lowest since 14 October. After its strongest session since April 2025 on Wednesday, the index is heading for its weakest since the same month on Thursday, with the same election outcome driving both moves. Of its thirty constituents, twenty-nine are down; Coca-Cola (KO) is the sole exception.

What began as a sell-off in chipmakers has spread across the market. More than 10% now separates the Nasdaq Composite from its October record, while chip stocks collectively are heading for their worst session since March 2020. At 28, the Cboe Volatility Index (VIX) reached its highest level since 31 March. Tuesday's outcome is being read by investors as a verdict on data-centre expansion, a trade to which the Dow has less exposure than the other two indices.
Why did Goldman Sachs weigh three times as much as Nvidia?
Share prices, rather than company size, determine each constituent's influence on the price-weighted Dow. Trading at about $870 a share, Goldman Sachs (GS) represents a tenth of the index; its roughly 6% decline explains around a fifth of the points lost. By contrast, Nvidia (NVDA), at about $180, carries a 2% weight, leaving its 9% fall responsible for about 6% of the loss. Despite falling more sharply than the bank, the $4 trillion company moved the Dow only about a third as far.
The next-largest drag is Caterpillar (CAT). In its third-quarter results, reported on 29 October, power generation sales increased 30% to $3.42 billion, largely from turbines and large engines supplied to data centres. No other constituent is as directly linked to the expansion now called into question by the election. Apple, Amazon, Alphabet, Microsoft and Nvidia, five of the biggest US technology companies, all belong to the index, yet their combined contribution is less than a fifth of the decline. Banks, industrials, healthcare and the remaining constituents account for the other four fifths.
A separate concern is weighing on banks. Senator Elizabeth Warren is expected to take over the Senate Banking Committee in January and has already urged regulators to withdraw three bank capital proposals. JPMorgan (JPM) has fallen about 4%. Together, JPMorgan and Goldman carry roughly 14% of the Dow's price-weighted index, versus about 2% of the S&P 500. As a result, the committee's stance on bank capital has a much greater impact on the Dow than on the broader benchmark.
How did March's moratorium bill set the stage for the backlash?
The legislative push dates to 25 March, when Senator Bernie Sanders and Representative Alexandria Ocasio-Cortez introduced the AI Data Center Moratorium Act. The bill seeks to stop new construction until Congress enacts artificial intelligence (AI) regulation. Following the results, Sanders renewed that demand on Wednesday. By that point, lawmakers in at least 11 states had proposed their own pauses.
Voters supported restrictions in nearly all of the more than 40 local data-centre measures on Tuesday's ballots. In Texas and Ohio, both centres of the construction boom, Democrats captured the Senate seat and governor's office after campaigns that featured data centres as an issue. According to Fitch, regulatory obstacles may affect a major share of planned capacity in Texas, Georgia and Ohio. UBS estimates that construction halts could threaten about 30% of the capacity scheduled for 2028. Even Alphabet (GOOGL), which announced a $17 billion data centre in Wyoming during the session, saw its shares decline alongside the rest of the market.
Can Friday's payrolls shift an already-priced December outlook?
Markets paid little attention to Thursday's encouraging economic releases. In the week to 31 October, initial jobless claims dropped to 189K, below the 196K forecast and matching the lowest reading since 1969. Productivity in the third quarter expanded 3.6%, ahead of the expected 2.5%, while unit labour costs declined 0.7%, their first fall since the second quarter of 2025. Nevertheless, the 10-year Treasury yield slipped to about 4.85%.
Inflation pressures are spreading through the economy and the labour market could strengthen, according to Cleveland Fed President Beth Hammack. Richmond Fed President Tom Barkin identified inflation as the Fed's biggest risk and said the AI construction boom had increased demand. He added that data centres employ too few workers to build natural constituencies within their host communities. After the Fed left rates at 3.75%-4.00% on 28 October, futures put the probability of an increase at the 9 December meeting at close to 80% ahead of the session.
Due on Friday at 13:30 GMT, October payrolls are forecast at 65K, compared with 29K in September. Unemployment is expected to remain at 4.2%, with average hourly earnings at 0.3% MoM. A reading close to expectations would leave the December increase in place, adding higher borrowing costs to Thursday's concerns about slower construction. A weaker reading would reduce the likelihood of an increase but introduce a slowing economy, offering a different reason to sell the same index. This is the first of two payroll reports the Fed will receive before 9 December, yet futures have already priced the meeting without either release.
Is the 200-day average now within reach?
Resistance: Near 52,150, the 50-day Exponential Moving Average (EMA) presents the initial hurdle. The index closed above it on Wednesday for the first time since 29 October, but held that position for just one session. Further up sit the late-October peak around 52,900 and Thursday's pre-open peak just below 53,800, the point at which the results-driven rally stalled.
Support: The next level below Thursday's trough just under 51,500, the lowest since 14 October, is the 14 October low near 51,400. Further downside would bring the early-October lows around 51,000 into view, the foundation for the advance that began on 1 October.
Bias: A short bias remains appropriate while closes are capped by the 50-day EMA near 52,150. The early-October lows around 51,000 are the first target, followed by the 200-day EMA near 50,800, a level the index has not traded at since 7 April. Around 57, the daily Stochastic Relative Strength Index (Stoch RSI) is halfway down from its late-October peak and continues to decline. A daily close above 52,150 would reduce Thursday's move to a one-day event, like Wednesday's, and end the short position.
Dow Jones Industrial Average: 5-minute chart
Dow Jones: frequently asked questions
Comprising the 30 most actively traded US stocks, the Dow Jones Industrial Average ranks among the world's oldest stock market indices. Its weights depend on share prices, not market capitalisation. To calculate the index, the constituent share prices are added together and divided by a factor that currently stands at 0.152. Charles Dow, who also established the Wall Street Journal, founded the index. It has subsequently faced criticism for offering insufficiently broad representation: it follows only 30 conglomerates, unlike wider benchmarks such as the S&P 500.
The combined performance of its constituent businesses, as shown in their quarterly earnings reports, is the principal driver of the Dow Jones Industrial Average (DJIA). Several other influences also matter. By shaping investor sentiment, US and global macroeconomic releases affect the index. Interest rates set by the Federal Reserve (Fed) influence borrowing costs, which are important to the many corporations that rely heavily on credit. Inflation, alongside other indicators that guide Fed decisions, can therefore be a significant driver of the DJIA.
Developed by Charles Dow, Dow Theory seeks to establish the stock market's primary trend. It involves comparing the direction of the Dow Jones Industrial Average (DJIA) with that of the Dow Jones Transportation Average (DJTA), following a trend only when both move the same way. Trading volume serves as confirmation, while analysis of peaks and troughs also forms part of the method. Dow's theory sets out three phases: accumulation, as smart money begins buying or selling; public participation, as the wider public enters; and distribution, as smart money leaves.
Investors can gain exposure to the DJIA through several instruments. ETFs offer a way to trade the index as one security without purchasing shares in each of its 30 constituent companies; the SPDR Dow Jones Industrial Average ETF (DIA) is a leading example. Traders can use DJIA futures contracts to speculate on the index's future value. Options, meanwhile, confer the right, but not the obligation, to buy or sell the index at a price fixed in advance for a future date. Buying units in mutual funds provides a share of a diversified portfolio of DJIA stocks and, in turn, exposure to the index as a whole.
POPULAR ARTICLES
1Yen gains following BoJ minutes as Ueda and US NFP take focus on Friday2Kiwi returns below 0.5600 as New Zealand heads to Saturday’s vote3Can the Euro withstand pressure from Friday's US NFP release after retreating from a one-month high?4Pound gives back BoE rate-hike gains ahead of Friday's US payrolls5Mexican Peso tumbles as unexpected Banxico rate cut strengthens easing bets6Ethereum Price Forecast: How is the AI sell-off hitting crypto as ETH drops 7%?7Data-centre backlash wipes out the Dow Jones Industrial Average’s midterm rally8Chinese Yuan: Appreciation constrained by PBoC resistance – Societe Generale9As NASDAQ 100 plunges and December hike bets retreat, gold surges above $4,100


Get Started!
Sign up and access the Global Markets in less than 3 minutes

Connect With Us









Contacts
Phone: +61 2 8036 8388
Fax: +61 2 8036 8388
Email: support@tmgm.com



The information provided on this website is of a general nature only and does not constitute personal financial advice. Before acting on any information on this website, you should consider the suitability of the information in relation to your objectives, financial situation and needs. Investing in CFDs and FX Margin Contracts carries significant risks and is not suitable for all investors. You may lose more than your initial deposit. You do not own, or have, any interest in the underlying asset. We recommend that you seek independent advice and ensure you fully understand the risks involved before trading. It is important that you read and consider the disclosure document before you acquire any product listed on the website. The information and advertisements offered on this website are not intended for use by any person in any country or jurisdiction where such use would be contrary to local laws and regulations. The Products and Services offered on this website are not intended for residents of the United States, Malaysia and Thailand.
TMGM is authorized and regulated in various jurisdictions.
Trademax Australia Limited, trading as TMGM, is regulated by the Australian Securities and Investments Commission (ASIC), AFSL no. 436416 and is located at Level 28, One International Tower, 100 Barangaroo Avenue, 2000 Sydney, NSW Australia.
Email: support@tmgm.com.au
Trademax Global Limited, trading as TMGM, is authorized and regulated by the Vanuatu Financial Services Commission (VFSC), registration number 40356 and registered at 1276, Kumul Highway, Port Vila, Vanuatu, Republic of Vanuatu.
Email: support@tmgm.com
Trademax Global Markets (SE) Limited, trading as TMGM, is authorized and regulated by the Financial Services Authority (FSA) of Seychelles, with license number SD224. The company is registered at Office No 13, Providence Estate ABIS Centre, Mahe, Seychelles.
Email: support@tmgm.com
Trademax Global Markets (International) Pty Ltd, trading as TMGM, is authorized and regulated by the Financial Services Commission, Mauritius (FSC) with license no. GB22201012, and registered at 33, Edith Cavell Street C/o IQ EQ Fund Services (Mauritius) Ltd Port Louis, 11324 Mauritius.
Email: support@tmgm.com
Copyright © TMGM. All rights reserved