
News & AnalysisCareer

Democratic victories in both chambers of the United States (US) Congress weigh on the US Dollar (USD) on Wednesday, leaving it trailing its major currency counterparts.
Today's percentage movements in the US Dollar (USD) against the major currencies listed are set out below. Its largest decline was against the Swiss Franc.
| USD | EUR | GBP | JPY | CAD | AUD | NZD | CHF | |
|---|---|---|---|---|---|---|---|---|
| USD | -0.50% | -0.53% | -0.36% | -0.38% | -0.51% | -0.22% | -0.59% | |
| EUR | 0.50% | -0.02% | 0.14% | 0.10% | -0.02% | 0.27% | -0.09% | |
| GBP | 0.53% | 0.02% | 0.17% | 0.15% | 0.02% | 0.30% | -0.07% | |
| JPY | 0.36% | -0.14% | -0.17% | -0.02% | -0.16% | 0.12% | -0.24% | |
| CAD | 0.38% | -0.10% | -0.15% | 0.02% | -0.14% | 0.14% | -0.22% | |
| AUD | 0.51% | 0.02% | -0.02% | 0.16% | 0.14% | 0.28% | -0.08% | |
| NZD | 0.22% | -0.27% | -0.30% | -0.12% | -0.14% | -0.28% | -0.35% | |
| CHF | 0.59% | 0.09% | 0.07% | 0.24% | 0.22% | 0.08% | 0.35% |
Percentage movements between the major currencies are displayed in the heat map. Select the base currency in the left-hand column and the quote currency in the top row. Selecting the US Dollar on the left and following its row across to the Japanese Yen, for instance, gives the percentage change for USD (base)/JPY (quote) in the corresponding cell.

At the time of writing, a 0.43% decline leaves the US Dollar Index (DXY) near 101.40. The index, which measures the Greenback against six major currencies, remains close to the monthly low of 101.25 reached earlier in the day.
With Democrats taking control of both chambers of Congress, doubts have emerged over whether policies introduced by President Donald Trump’s administration can continue unimpeded, particularly support for investment in Artificial Intelligence (AI) infrastructure.
According to ING analysts, US political developments briefly rattled markets: “speculation over whether a new Democrat Congress would slow AI capex plans” prompted a steep, short-lived response. As they point out, the “chip exporter-heavy stock markets of Korea and Taiwan were briefly down 3-4% overnight on news of the blue wave, but have since recouped all those losses.” Interest-rate and currency markets have followed a comparable course, with “US two-year yields have reclaimed most of their 8-9bp drop and the likes of USD/CHF and USD/JPY have reversed around half of their 1% fall in early Asia.”
In ING’s view, the retracement “probably owes to the fact that the Democrats do not take office until January,” and the bank adds that “one wild-card risk removed from the dollar's downside has been President Trump accepting these results.”
Nevertheless, as markets may price in the policy consequences of a Democrat Congress more fully in 2027, ING warns that “overnight price action could provide a preview for markets in 2027,”. Its strategists repeat that they “had felt that a Democrat Congress would be a mild dollar negative – both in terms of what it would mean for the AI story and the prospect of a prolonged US government shutdown potentially from next summer.”
October’s US ADP Employment Change report and ISM Services PMI, both due later in the day, are the key economic releases investors are awaiting.
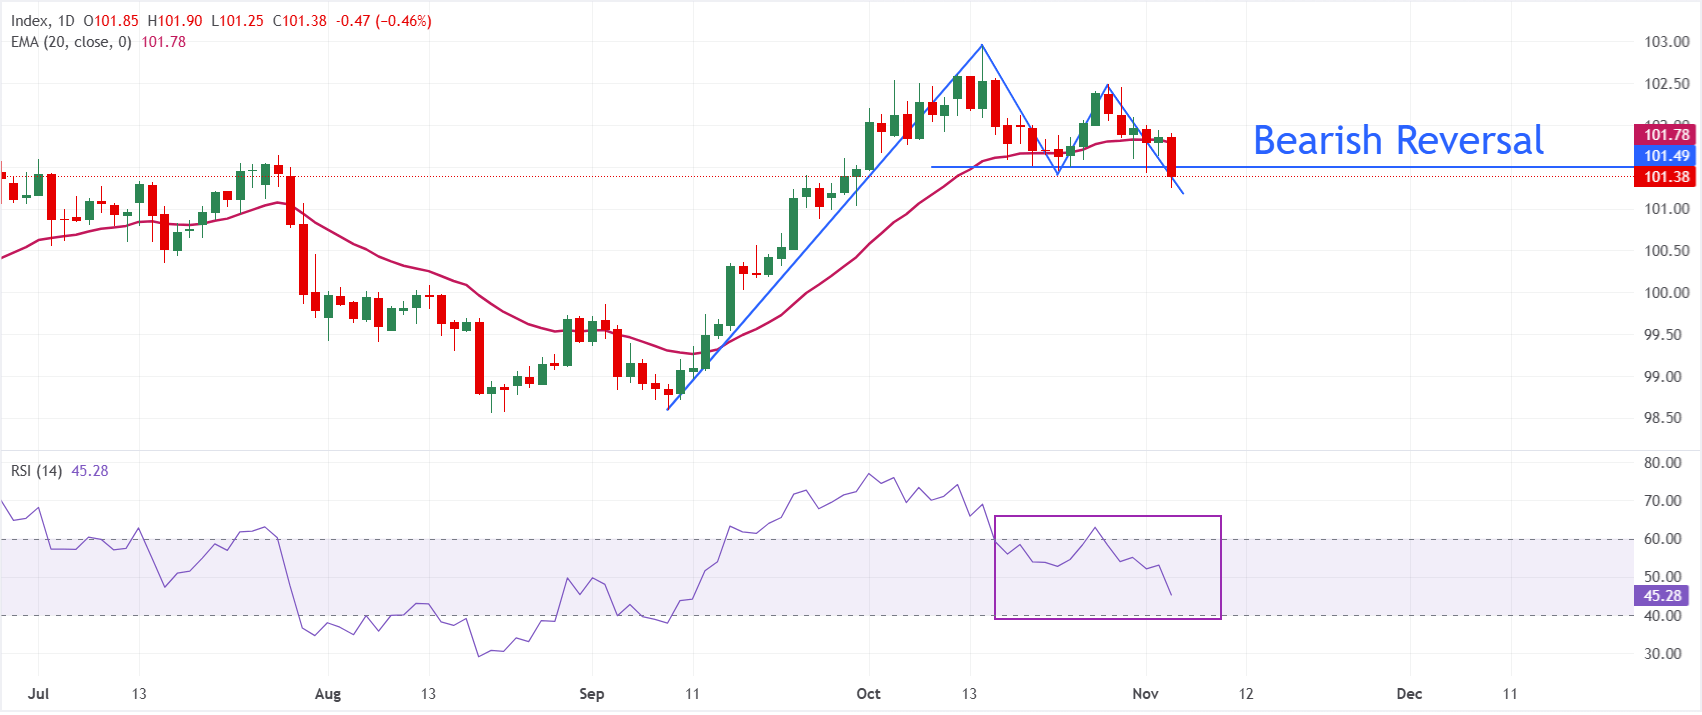
Trend: Below both the 20-day Exponential Moving Average (EMA) at 101.78 and successive descending trend-line barriers, Dollar Index Spot trades at 101.38 on the daily chart. This leaves the near-term outlook mildly bearish.
Upside momentum appears to be waning, with the Relative Strength Index (14) recently slipping to 45.28. That reading supports the view that recoveries are likely to face a ceiling while the price remains below the resistance cluster formed by the short-term EMA and descending trend lines from 102.46 and 102.96.
A break below 101.25 could open the way to renewed losses. To the upside, the former short-term rising trend line now offers initial resistance near 101.40, followed by the 20-day EMA at 101.78. More substantial selling pressure is evident at the descending trend lines around 102.46 and 102.96.
(The technical analysis of this story was written with the help of an AI tool. Know more.)
Held midway through a president’s four-year term, US midterms are federal elections in which voters elect all 435 House of Representatives members and roughly one-third of the Senate. In many states, ballots also cover governors and other state and local officeholders.
Tuesday, 3 November 2026 is Election Day, in line with federal law requiring the vote to fall on the Tuesday following November’s first Monday. Many states already have early and postal voting under way.
Control of both congressional chambers during the final two years of President Donald Trump’s term is determined by these elections. Setting the legislative programme and appointing committee leaders fall to the majority party; in the Senate, it also oversees confirmation of judges and senior officials.
There is no presidential vote in these elections. Presidential elections occur every four years, with the next scheduled for November 2028. Often treated as a referendum on the incumbent president’s party, midterms have historically tended to cost that party seats in the House.
A limited, temporary response in the US Dollar, rather than an enduring trend, is what most analysts anticipate. Markets widely regard a divided Congress as the central scenario and have already priced it in to some extent, although Treasury yields may respond more visibly to the outcome. Results that increase expectations of fiscal stimulus generally push yields and the US Dollar higher; legislative deadlock constraining additional spending can weigh on both. Disputes over funding or the debt ceiling may also briefly support the Dollar’s safe-haven appeal. Over six to twelve months, however, economic growth and Federal Reserve policy carry more weight than the election.
Historically, US shares have tended to struggle ahead of midterms before gaining strength afterwards. Since 1950, the S&P 500 has recorded a gain 12 months after each midterm election, making it 19 out of 19, with an average increase of about 15%. Analysts attribute this pattern to the easing of uncertainty once the outcome is clear. Past performance does not guarantee future returns, and some strategists warn that elevated valuations in 2026 could challenge that record.
By reducing the likelihood of sweeping tax, spending and regulatory changes, political gridlock has often made divided government attractive to markets. With a Republican in the White House, the S&P 500 has historically performed well in the years after midterms that divide control of Congress. Funding deadlines, debt-ceiling disputes and congressional investigations remain risks that can heighten short-term volatility.







Phone: +61 2 8036 8388
Fax: +61 2 8036 8388
Email: support@tmgm.com



The information provided on this website is of a general nature only and does not constitute personal financial advice. Before acting on any information on this website, you should consider the suitability of the information in relation to your objectives, financial situation and needs. Investing in CFDs and FX Margin Contracts carries significant risks and is not suitable for all investors. You may lose more than your initial deposit. You do not own, or have, any interest in the underlying asset. We recommend that you seek independent advice and ensure you fully understand the risks involved before trading. It is important that you read and consider the disclosure document before you acquire any product listed on the website. The information and advertisements offered on this website are not intended for use by any person in any country or jurisdiction where such use would be contrary to local laws and regulations. The Products and Services offered on this website are not intended for residents of the United States, Malaysia and Thailand.
TMGM is authorized and regulated in various jurisdictions.
Trademax Australia Limited, trading as TMGM, is regulated by the Australian Securities and Investments Commission (ASIC), AFSL no. 436416 and is located at Level 28, One International Tower, 100 Barangaroo Avenue, 2000 Sydney, NSW Australia.
Email: support@tmgm.com.au
Trademax Global Limited, trading as TMGM, is authorized and regulated by the Vanuatu Financial Services Commission (VFSC), registration number 40356 and registered at 1276, Kumul Highway, Port Vila, Vanuatu, Republic of Vanuatu.
Email: support@tmgm.com
Trademax Global Markets (SE) Limited, trading as TMGM, is authorized and regulated by the Financial Services Authority (FSA) of Seychelles, with license number SD224. The company is registered at Office No 13, Providence Estate ABIS Centre, Mahe, Seychelles.
Email: support@tmgm.com
Trademax Global Markets (International) Pty Ltd, trading as TMGM, is authorized and regulated by the Financial Services Commission, Mauritius (FSC) with license no. GB22201012, and registered at 33, Edith Cavell Street C/o IQ EQ Fund Services (Mauritius) Ltd Port Louis, 11324 Mauritius.
Email: support@tmgm.com
Copyright © TMGM. All rights reserved

