
News & AnalysisCareer

An increase in US Personal Consumption Expenditure (PCE) inflation was followed by a 4.8% fall in Ethereum (ETH) on Thursday, taking the price below $2,300.
September's PCE Price Index rose 0.5% month on month and 3.6% year on year, in line with market forecasts. Excluding volatile food and energy prices, core PCE advanced 0.3% on a monthly basis and 3.1% annually, also matching expectations.

Following the inflation figures, investors continued to assign an 80% probability to a rate increase at the Federal Reserve's (Fed) December meeting, according to the CME FedWatch tool.
At its October meeting on Wednesday, the Fed voted 10-2 to keep interest rates unchanged, a decision widely characterised as a hawkish hold.
Ethereum derivatives were already displaying a short-term bearish bias as the inflation figures arrived.
On Binance, ETH Net Taker Volume remains below zero. This metric tracks the difference between buying and selling volumes among perpetual futures traders placing market orders. Its 30-day moving average reached a four-month low of -166.6M on 16 October before the negative reading narrowed modestly to -117.3M on Wednesday, suggesting that bears still control near-term market sentiment.
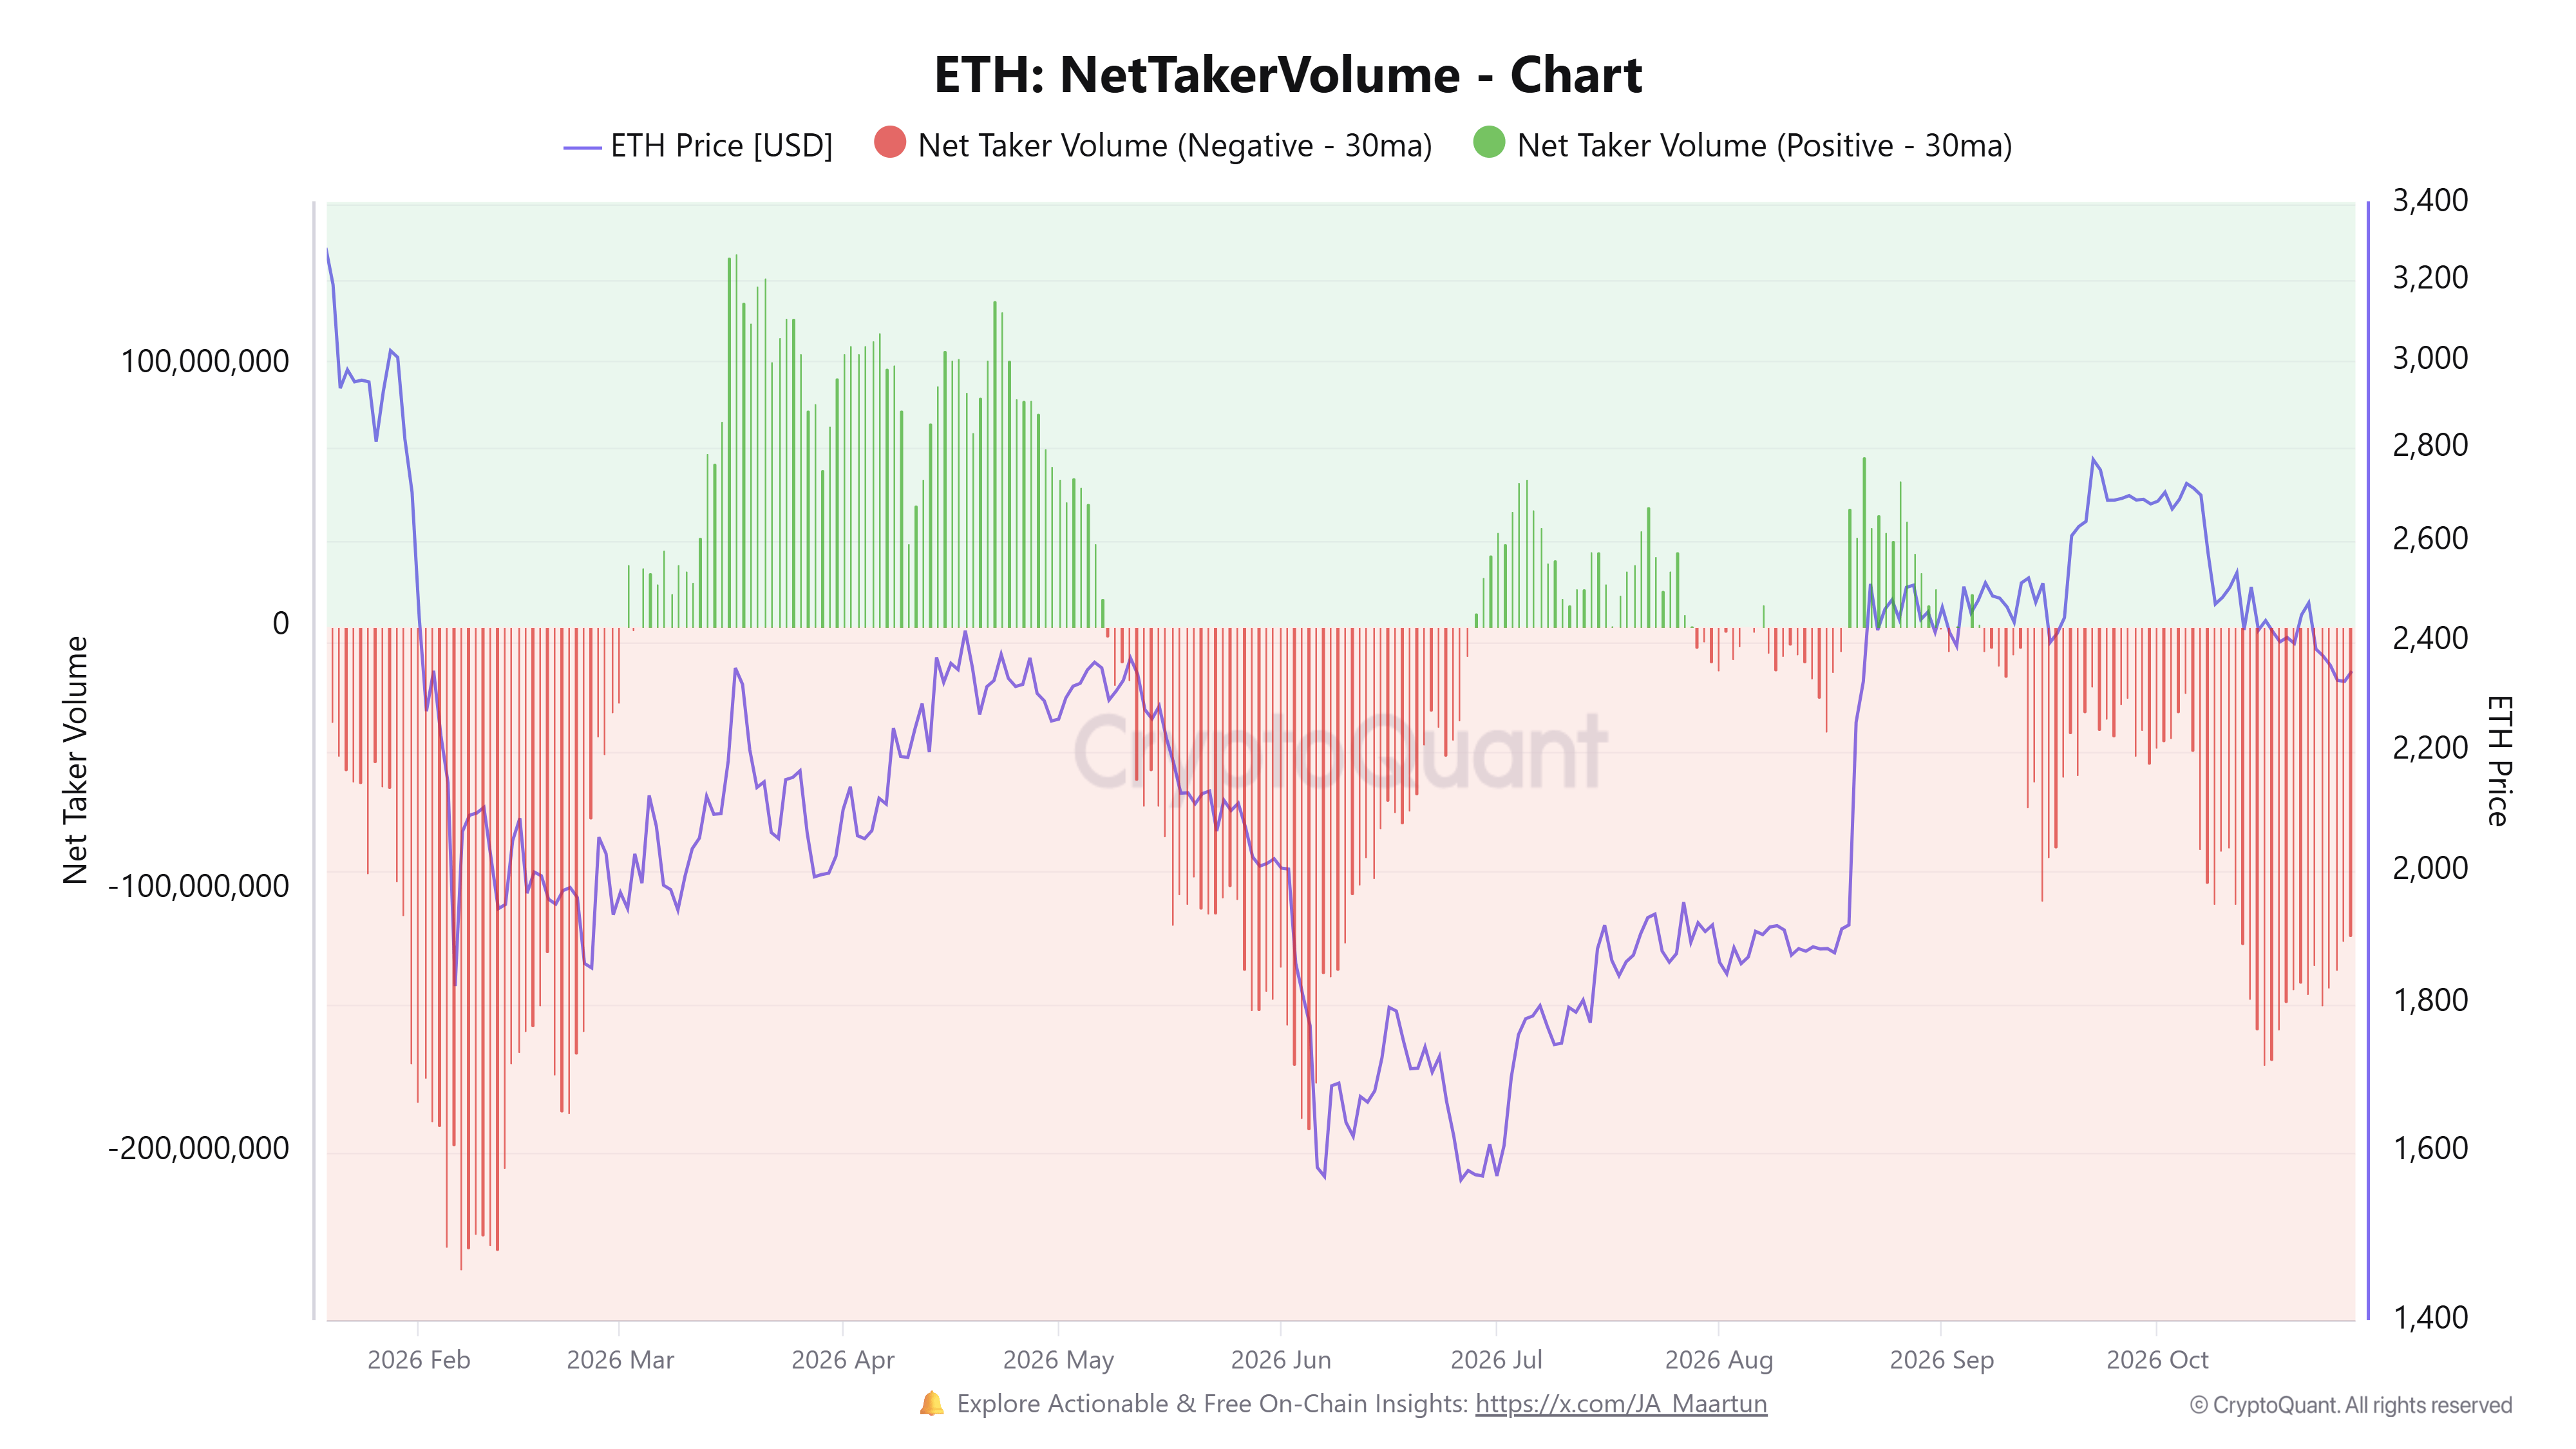
Funding rates, however, have stayed positive. In contrast to the immediate market mood, this indicates that traders retain a longer-term upside bias in ETH. Funding rates measure the periodic payments exchanged between long and short positions in perpetual futures, designed to keep the contract price aligned with the underlying asset's spot price. When funding is positive, traders holding long positions pay those holding shorts to maintain their dominance.
Following September's decline, open interest, which represents the total value of outstanding ETH futures contracts, has remained close to 12.7M ETH for much of October.
US spot ETH exchange-traded funds (ETFs) also extended their run of outflows on Wednesday. Net withdrawals totalled $21.4 million, marking the third consecutive day of net outflows.
Over the past 24 hours, Ethereum liquidations have totalled $224.5 million, with long positions accounting for $187.6 million.
Trading below the 20-, 50-, 100- and 200-day Exponential Moving Averages (EMAs), ETH continues to show a bearish bias on the daily chart. These averages are grouped between roughly $2,311 and $2,445. The 14-day Relative Strength Index (RSI), at 34, and the Stochastic, at 8, are in oversold territory. Together, they suggest that downward pressure still prevails, even as the sell-off begins to appear stretched.
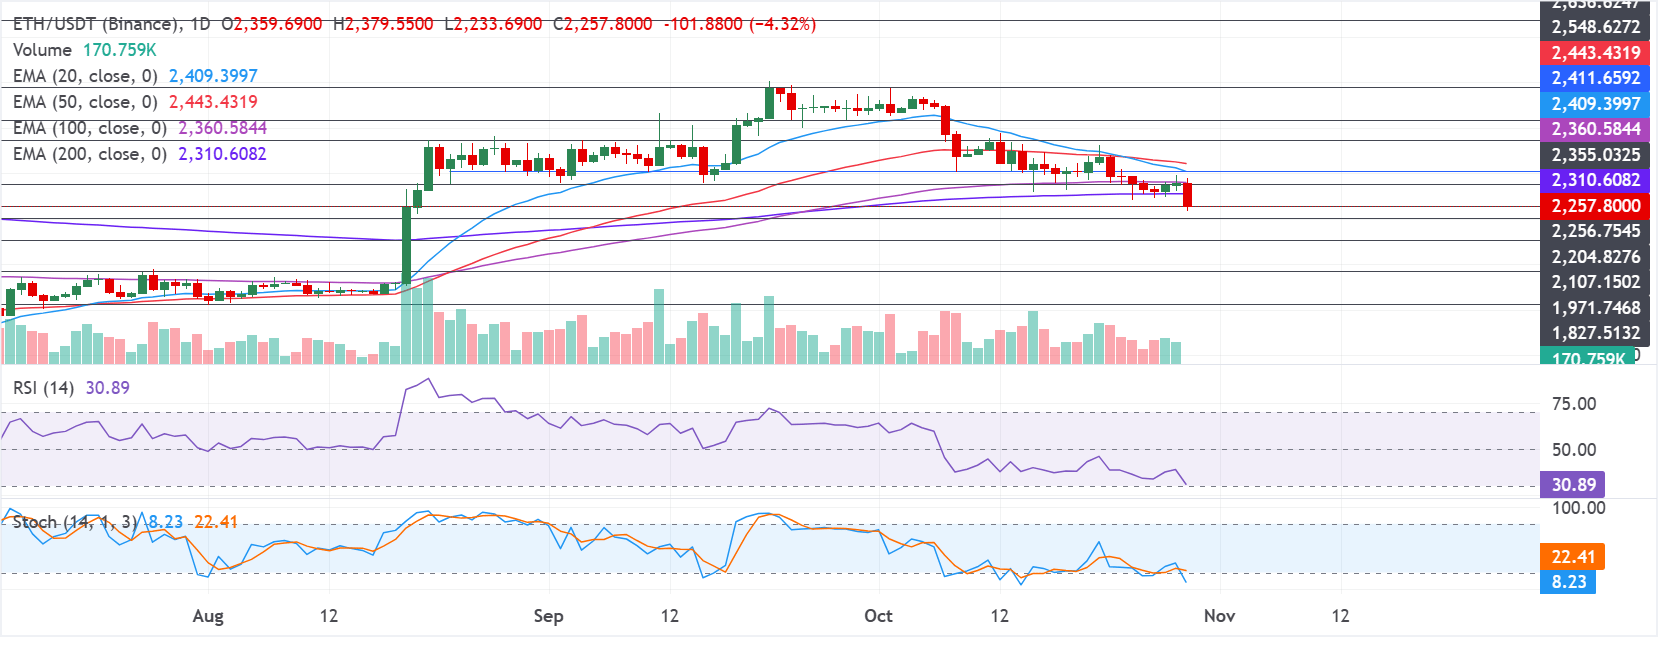
Any rebound would first encounter the horizontal resistance level at $2,355 and the 100-day EMA near $2,360. Above these, the 20- and 50-day EMAs at $2,409 and $2,443 add to a dense supply zone. If ETH cannot reclaim the 200-day EMA at $2,310, immediate downside support lies at $2,205, followed by $2,107. A more pronounced correction driven by sellers would bring the lower support levels of $1,972 and $1,828 into view.
(The technical analysis of this story was written with the help of an AI tool. Learn more.)







Phone: +61 2 8036 8388
Fax: +61 2 8036 8388
Email: support@tmgm.com



The information provided on this website is of a general nature only and does not constitute personal financial advice. Before acting on any information on this website, you should consider the suitability of the information in relation to your objectives, financial situation and needs. Investing in CFDs and FX Margin Contracts carries significant risks and is not suitable for all investors. You may lose more than your initial deposit. You do not own, or have, any interest in the underlying asset. We recommend that you seek independent advice and ensure you fully understand the risks involved before trading. It is important that you read and consider the disclosure document before you acquire any product listed on the website. The information and advertisements offered on this website are not intended for use by any person in any country or jurisdiction where such use would be contrary to local laws and regulations. The Products and Services offered on this website are not intended for residents of the United States, Malaysia and Thailand.
TMGM is authorized and regulated in various jurisdictions.
Trademax Australia Limited, trading as TMGM, is regulated by the Australian Securities and Investments Commission (ASIC), AFSL no. 436416 and is located at Level 28, One International Tower, 100 Barangaroo Avenue, 2000 Sydney, NSW Australia.
Email: support@tmgm.com.au
Trademax Global Limited, trading as TMGM, is authorized and regulated by the Vanuatu Financial Services Commission (VFSC), registration number 40356 and registered at 1276, Kumul Highway, Port Vila, Vanuatu, Republic of Vanuatu.
Email: support@tmgm.com
Trademax Global Markets (SE) Limited, trading as TMGM, is authorized and regulated by the Financial Services Authority (FSA) of Seychelles, with license number SD224. The company is registered at Office No 13, Providence Estate ABIS Centre, Mahe, Seychelles.
Email: support@tmgm.com
Trademax Global Markets (International) Pty Ltd, trading as TMGM, is authorized and regulated by the Financial Services Commission, Mauritius (FSC) with license no. GB22201012, and registered at 33, Edith Cavell Street C/o IQ EQ Fund Services (Mauritius) Ltd Port Louis, 11324 Mauritius.
Email: support@tmgm.com
Copyright © TMGM. All rights reserved


