
News & AnalysisCareer

Last week’s fall of over 9% extended Cardano’s (ADA) losing run to five consecutive weeks since early October, with the token settling around $0.176 on Monday. Reductions in ADA holdings among large whale cohorts lend further weight to the bearish price trend. Meanwhile, softer on-chain readings and a worsening technical picture point to the possibility of additional losses.

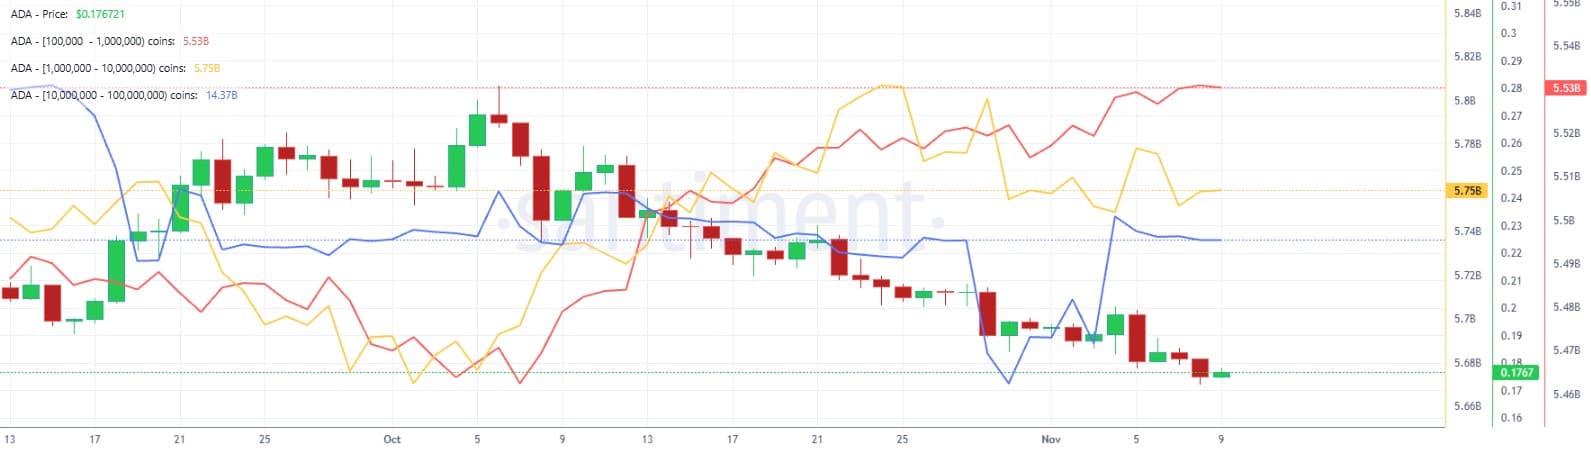
A reduction in exposure among large-wallet holders, or whales, underpins the bearish view of Cardano in Santiment’s Supply Distribution data.
Since 4 November, wallets holding between 10 million and 100 million tokens (blue line) have cut their holdings by 50 million tokens, the metric shows.
Over the same period, 20 million ADA has been accumulated by whales with holdings of between 100,000 and 1 million (red line) and those with between 1 million and 10 million (yellow line). The figures point to changing positioning among large holders: as top-tier and mid-sized whales pare back exposure, smaller whales are taking up some of the supply. Such a pattern often signals distribution, increasing Cardano’s near-term downside risks.
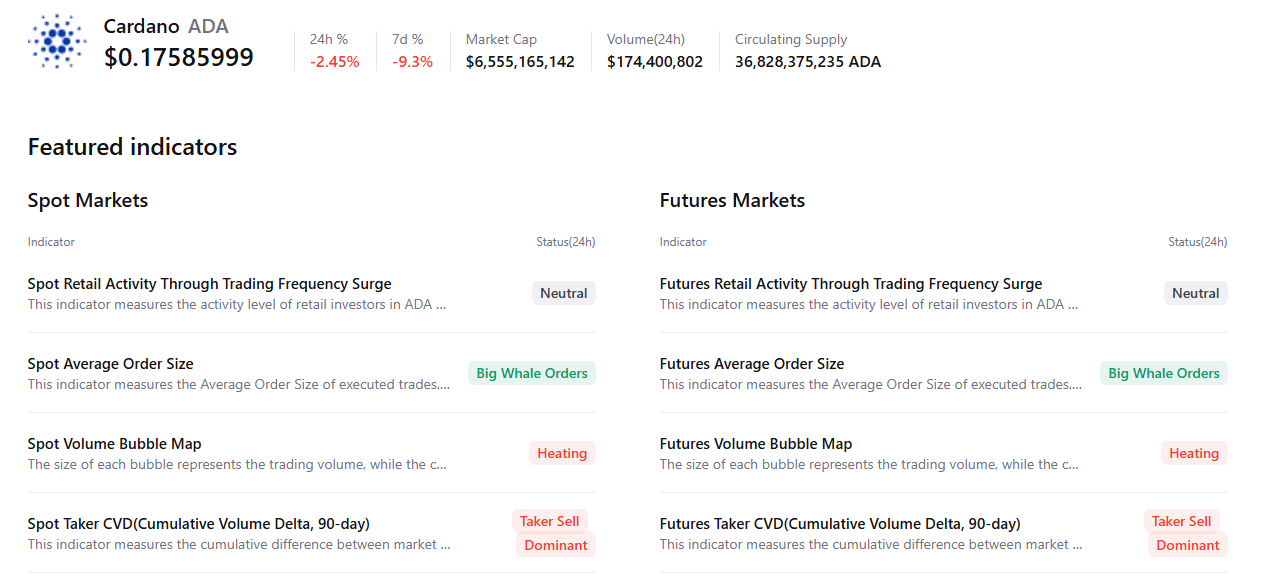
Caution is evident in CryptoQuant’s summary data. Although large whale orders are present in ADA’s spot and futures markets, conditions are overheated and sellers dominate. Together, these readings point to a cautious, bearish bias among Cardano traders.
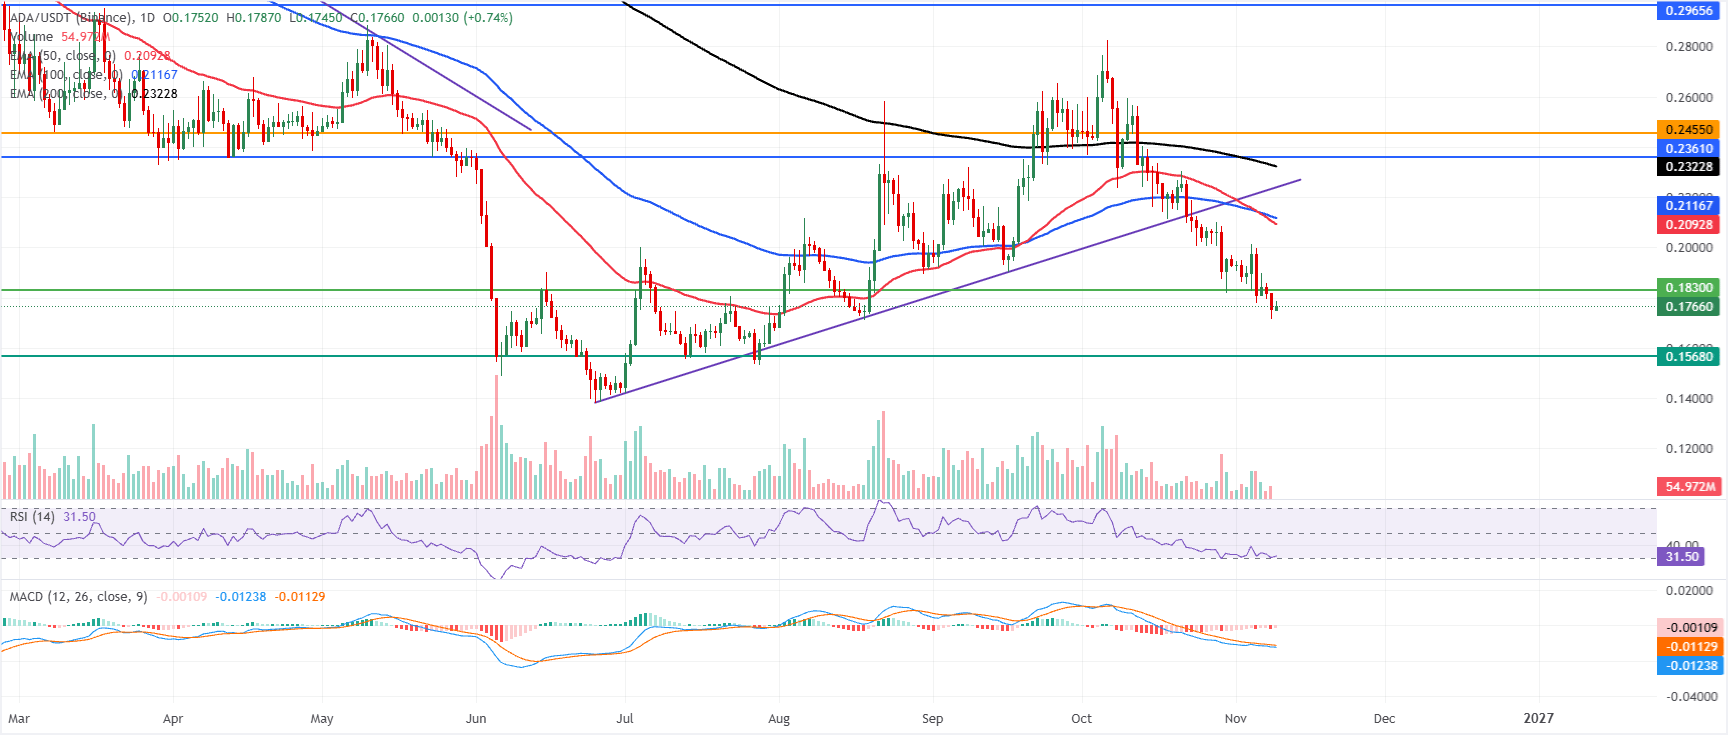
Trading at $0.176 on Monday, Cardano retains a bearish short-term bias below its 50-day Exponential Moving Average (EMA) at $0.209, 100-day EMA at $0.211 and 200-day EMA at $0.232. With these EMAs grouped above the price, the recent rebound from below $0.180 appears corrective for now. The Relative Strength Index (RSI), near 32, points to weak but stabilising momentum. Meanwhile, the Moving Average Convergence Divergence (MACD) remains marginally negative, reinforcing the subdued outlook below resistance from the broader downtrend.
The first upside hurdle is the horizontal resistance near $0.183. Beyond that lies the EMA cluster, beginning at $0.209 and $0.211 and stretching towards the longer-term cap at $0.2323. Higher up, further supply awaits at $0.236 and $0.245, followed by a more distant ceiling at $0.296.
The closest structural support on the downside is the horizontal level near $0.156. A decisive move back towards that area would open the way for deeper losses.
(The technical analysis of this story was written with the help of an AI tool. Know more.)







Phone: +61 2 8036 8388
Fax: +61 2 8036 8388
Email: support@tmgm.com



The information provided on this website is of a general nature only and does not constitute personal financial advice. Before acting on any information on this website, you should consider the suitability of the information in relation to your objectives, financial situation and needs. Investing in CFDs and FX Margin Contracts carries significant risks and is not suitable for all investors. You may lose more than your initial deposit. You do not own, or have, any interest in the underlying asset. We recommend that you seek independent advice and ensure you fully understand the risks involved before trading. It is important that you read and consider the disclosure document before you acquire any product listed on the website. The information and advertisements offered on this website are not intended for use by any person in any country or jurisdiction where such use would be contrary to local laws and regulations. The Products and Services offered on this website are not intended for residents of the United States, Malaysia and Thailand.
TMGM is authorized and regulated in various jurisdictions.
Trademax Australia Limited, trading as TMGM, is regulated by the Australian Securities and Investments Commission (ASIC), AFSL no. 436416 and is located at Level 28, One International Tower, 100 Barangaroo Avenue, 2000 Sydney, NSW Australia.
Email: support@tmgm.com.au
Trademax Global Limited, trading as TMGM, is authorized and regulated by the Vanuatu Financial Services Commission (VFSC), registration number 40356 and registered at 1276, Kumul Highway, Port Vila, Vanuatu, Republic of Vanuatu.
Email: support@tmgm.com
Trademax Global Markets (SE) Limited, trading as TMGM, is authorized and regulated by the Financial Services Authority (FSA) of Seychelles, with license number SD224. The company is registered at Office No 13, Providence Estate ABIS Centre, Mahe, Seychelles.
Email: support@tmgm.com
Trademax Global Markets (International) Pty Ltd, trading as TMGM, is authorized and regulated by the Financial Services Commission, Mauritius (FSC) with license no. GB22201012, and registered at 33, Edith Cavell Street C/o IQ EQ Fund Services (Mauritius) Ltd Port Louis, 11324 Mauritius.
Email: support@tmgm.com
Copyright © TMGM. All rights reserved


