

Savdo
Raqobatbardosh narxlar, chuqur likvidlik va ilg‘or savdo vositalari bilan keng turdagi bozorlarni kashf eting.
Batafsil ma’lumot 
Platforma
TMGM’ning tezlik, aniqlik va yuqori savdo tajribasi uchun yaratilgan kuchli platformasi bilan uzluksiz savdo qiling.
Batafsil ma’lumot Savdo platformasi
Savdo vositalari
Akademiya
Boshlovchilar uchun qulay resurslar, jumladan qo‘llanmalar, vebinarlar va bozor tahlillari orqali savdoning asoslarini o‘rganing.
Batafsil ma’lumot Yangiliklar va tahlil
Savdo imkoniyatlaridan oldinda bo‘lish uchun bozor yangilanishlari va ekspert tahlillarini real vaqt rejimida oling
Batafsil ma’lumot Yangiliklar va tahlil
Haqida
TMGMni boshqalardan ajratib turadigan jihatlarni bilib oling — bizning global mavjudligimiz, tartibga solishdagi mustahkamligimiz va savdoda innovatsiyalarga sodiqligimiz.
Batafsil ma’lumot Nega TMGMni tanlash kerak
NEAR Protocol Forecast: Bearish move extends despite House of Stake issuance cut approval
- NEAR Protocol extends losses below $4 on Tuesday after a 10% decline the previous day.
- House of Stake, NEAR’s decentralized on-chain governance body, passes a proposal to reduce the annual issuance rate.
- The technical outlook for NEAR indicates a downside bias as selling pressure mounts.
NEAR Protocol (NEAR) trades below $4 on Tuesday, following a 10% loss the previous day and three consecutive weeks of decline. House of Stake, NEAR’s decentralized on-chain governance body, approved a proposal to reduce annual issuance on Monday, lowering long-term inflation and supply growth. The technical outlook for NEAR suggests further decline as sellers control the momentum.

NEAR Protocol strengthens tokenomics
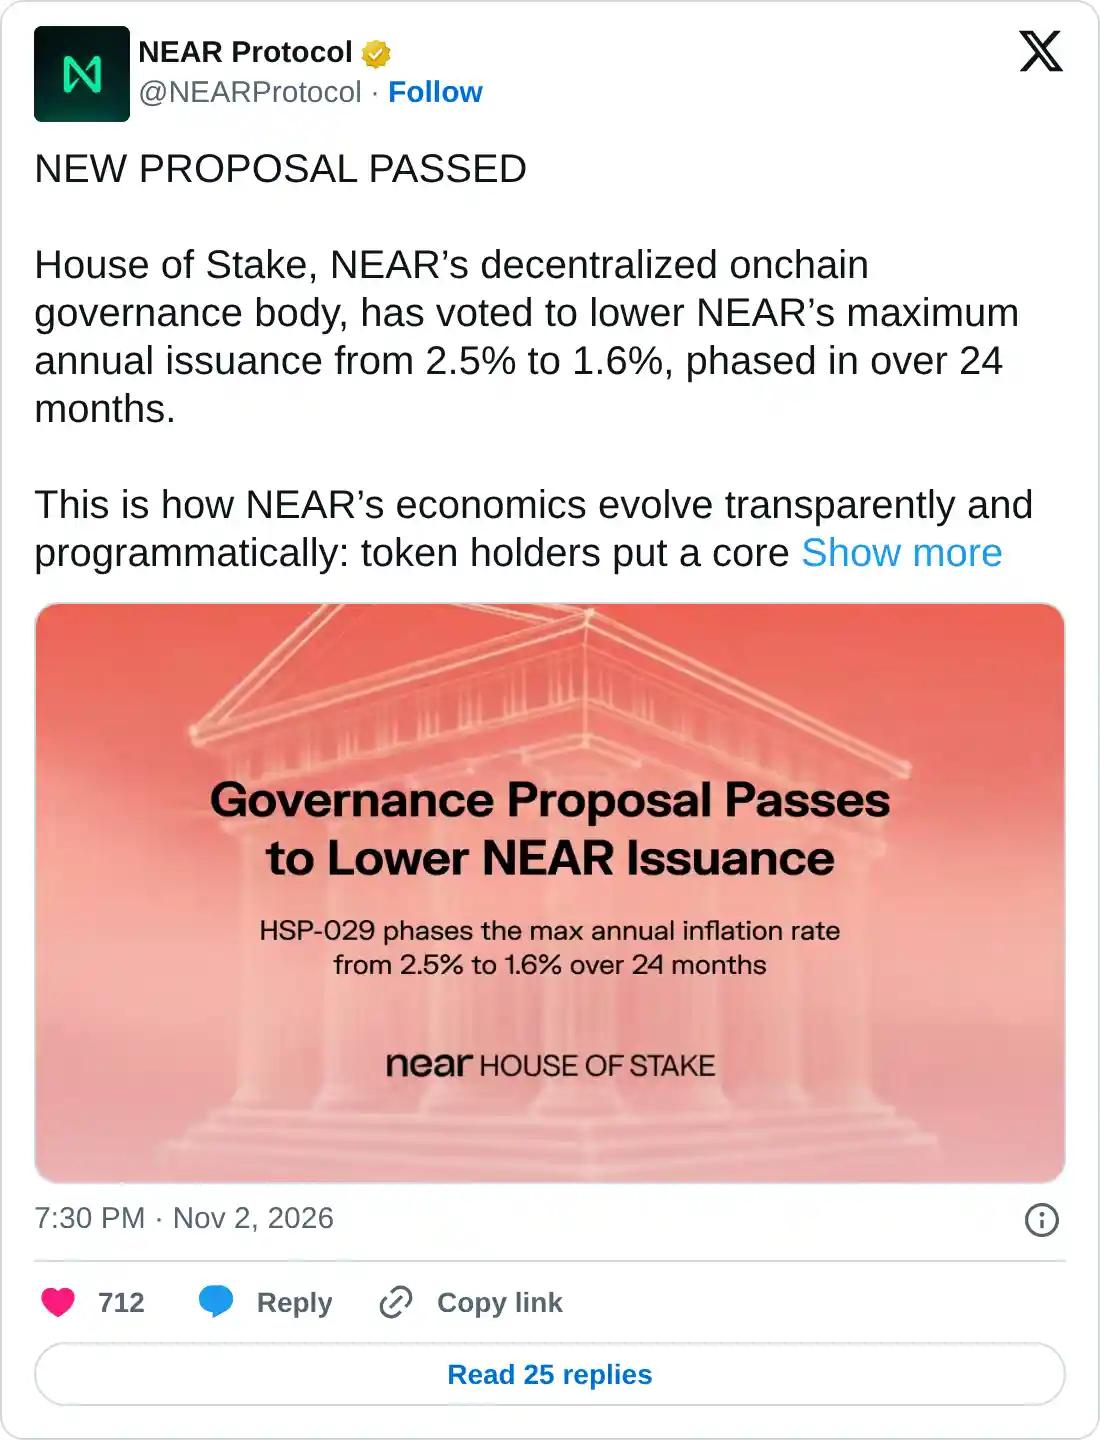
NEAR protocol’s governing body, House of Stake, approved the HSP-029 proposal to phase down the maximum annual token issuance from 2.5% to 1.6% over 24 months. The implementation will go through a Security Council review, a 90-day grace period, and a protocol upgrade for validators. This decision will programmatically lower long-term inflation and supply growth.
Retail demand returns
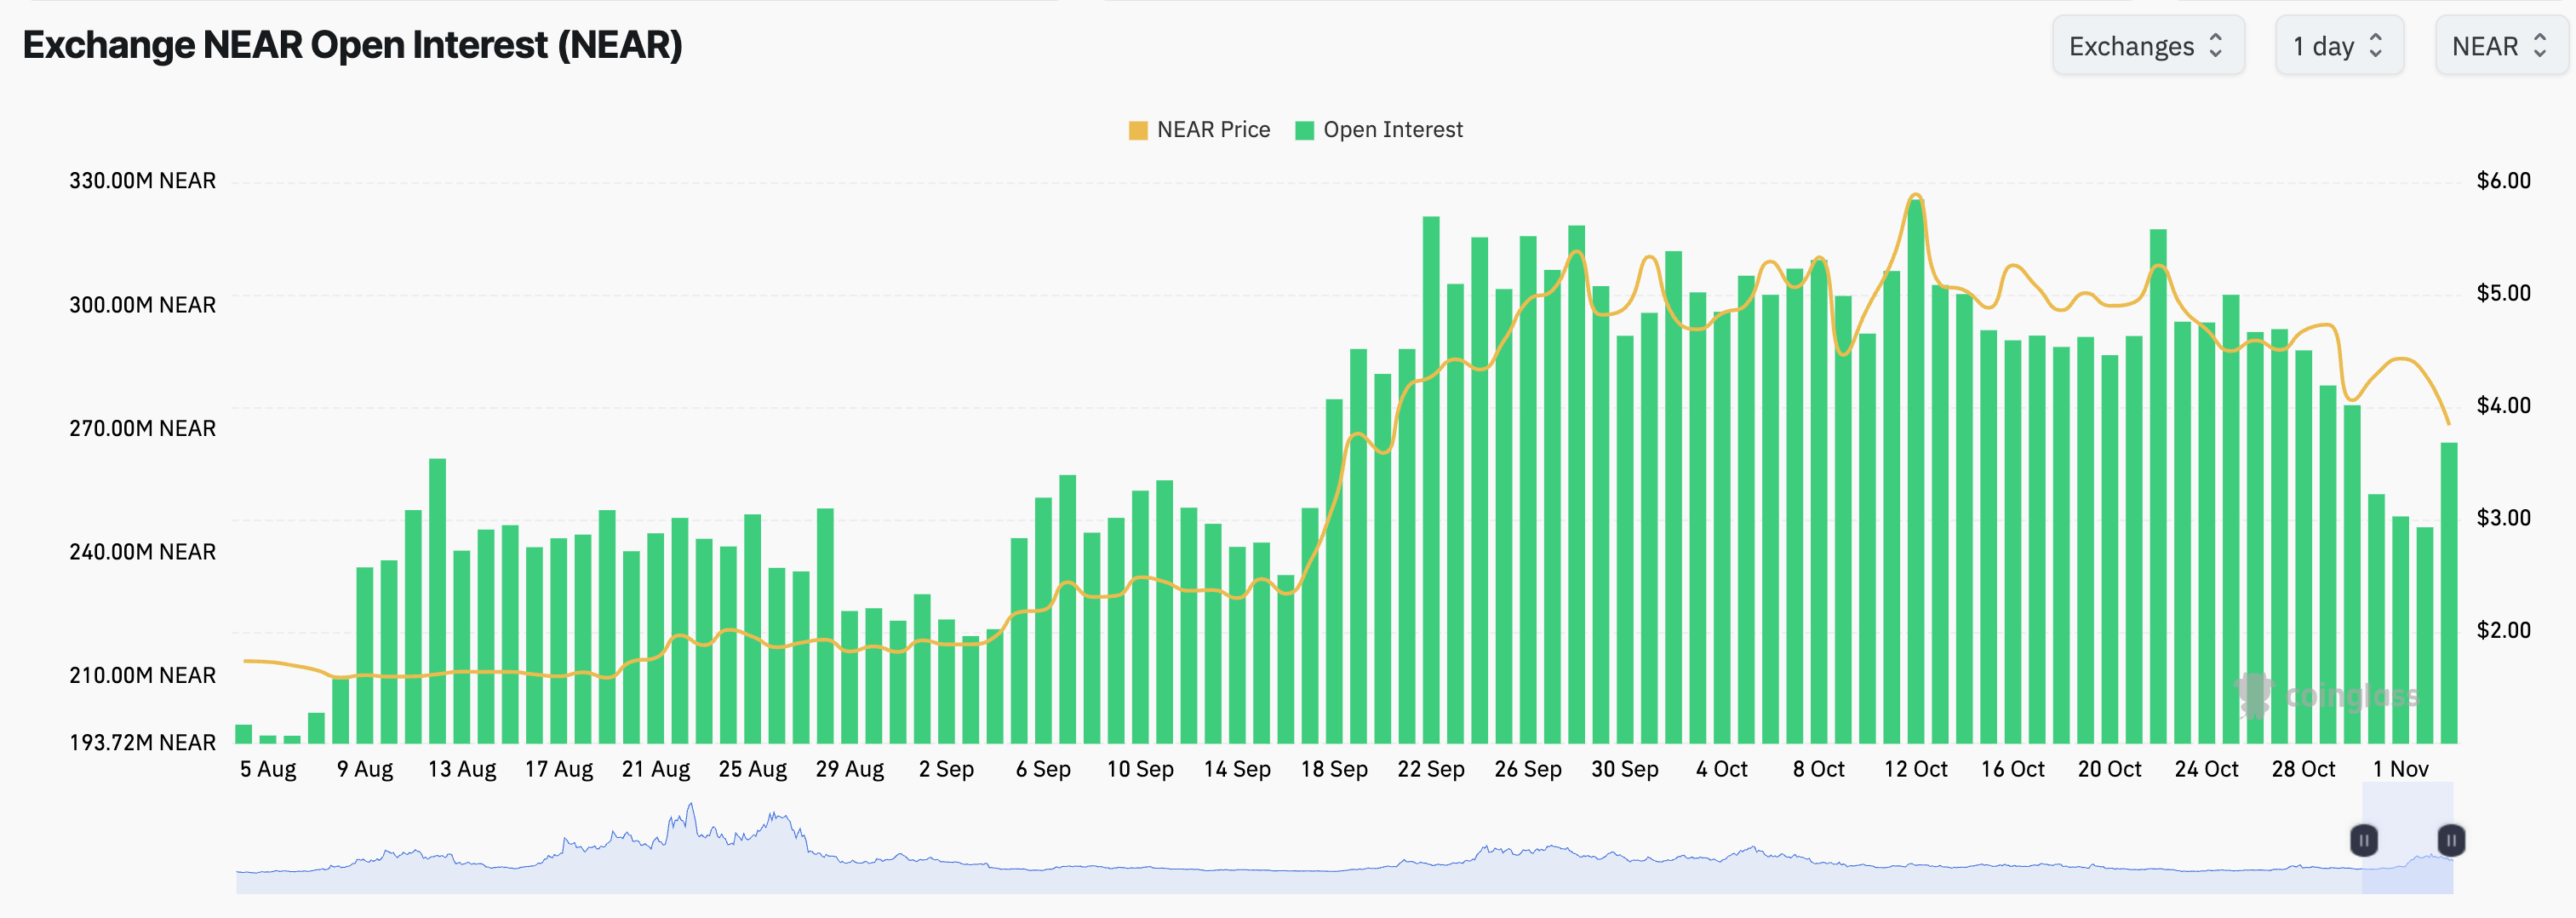
Retail interest in NEAR Protocol shows signs of building after a mild contraction phase. CoinGlass data shows the NEAR futures Open Interest at 266.81 million NEAR tokens on Tuesday, up from 246.27 million the previous day. The surge reflects a sharp recovery in fresh positional buildup, challenging the prevailing decline from the October 25 high of 302.69 million NEAR tokens. However, the OI growth amid the declining spot price implies that traders are anticipating further volatility.
Technical outlook: Will NEAR extend its decline?
NEAR token trades at $3.8270 at press time on Tuesday, indicating a bearish reversal on the four-hour chart. The price holds below both the 50- and 200-period Exponential Moving Averages (EMAs) at $4.3677 and $4.5235, respectively, maintaining a clear bearish bias. In addition, the 50-period EMA crosses below the 200-period EMA, reaffirming the bearish change in the near-term trend.
From a technical perspective, NEAR's decline is capped by a tight band of two parallel trendlines, forming a falling channel pattern on the same chart. The price approaches the lower-boundary trendline near $3.7303, guarding the downside toward the $3.4030 horizontal support set by the September 19 low.
Momentum is weak, with the Relative Strength Index (RSI) on the four-hour chart hovering around 26 in oversold territory and the Moving Average Convergence Divergence (MACD) deep in negative ground, hinting that downside pressure dominates.
On the topside, a potential rebound from the supporting trendline could test the support-turned-resistance level at $3.9160, followed by the $4.3010 level.
(The technical analysis of this story was written with the help of an AI tool. Know more.)
Eng yaxshi maqolalar
1Brent: Higher-for-longer price regime – TD Securities2Euro edges up against US Dollar in countdown to US Midterm elections3Swiss Franc: Upside momentum accelerates against US Dollar – UOB4Euro weakens against British Pound on soft German Retail Sales, traders await BoE rate decision 5Turkish Lira: Inflation risks keep pressure on TRY – Commerzbank6Gold: Recovery from one-year low remains fragile – ING7Swiss Franc gains momentum ahead of inflation data8NEAR Protocol Forecast: Bearish move extends despite House of Stake issuance cut approval9Euro: Key support at 1.1135 in focus against US Dollar – UOB


Boshlang!
Ro‘yxatdan o‘ting va 3 daqiqadan kamroq vaqt ichida Global bozorlariga kirish imkoniga ega bo‘ling

Biz bilan bog‘laning









Kontaktlar
Telefon: +61 2 8036 8388
Faks: +61 2 8036 8388
Email: support@tmgm.com



Ushbu veb-saytda taqdim etilgan ma’lumotlar faqat umumiy xususiyatga ega bo‘lib, shaxsiy moliyaviy maslahat hisoblanmaydi. Ushbu veb-saytdagi har qanday ma’lumot asosida harakat qilishdan oldin, ma’lumotning sizning maqsadlaringiz, moliyaviy ahvolingiz va ehtiyojlaringizga mosligini ko‘rib chiqishingiz kerak. CFD va FX Margin shartnomalariga sarmoya kiritish sezilarli xavflarni o‘z ichiga oladi va barcha investorlar uchun mos emas. Siz boshlang‘ich depozitingizdan ko‘proq yo‘qotishingiz mumkin. Siz asosiy aktivga egalik qilmaysiz va unda hech qanday manfaatga ega emassiz. Savdo qilishdan oldin mustaqil maslahat olishni va ishtirok etuvchi xavflarni to‘liq tushunishingizni tavsiya qilamiz. Veb-saytda keltirilgan har qanday mahsulotni xarid qilishdan oldin oshkor qilish hujjatini o‘qib chiqishingiz va ko‘rib chiqishingiz muhimdir. Ushbu veb-saytda taklif etilgan ma’lumotlar va reklama materiallari bunday foydalanish mahalliy qonunlar va qoidalarga zid bo‘ladigan har qanday mamlakat yoki yurisdiksiyadagi shaxslar tomonidan foydalanish uchun mo‘ljallanmagan. Ushbu veb-saytda taklif etilgan Mahsulotlar va Xizmatlar AQSh, Malayziya va Tailand rezidentlari uchun mo‘ljallanmagan.
TMGM turli yurisdiksiyalarda vakolatli va tartibga solinadi.
Trademax Australia Limited, TMGM nomi ostida faoliyat yuritadi, Avstraliya Qimmatli qog‘ozlar va investitsiyalar komissiyasi (ASIC) tomonidan tartibga solinadi, AFSL raqami 436416 va manzili: Level 28, One International Tower, 100 Barangaroo Avenue, 2000 Sydney, NSW Australia.
Email: support@tmgm.com.au
Trademax Global Limited, TMGM nomi ostida faoliyat yuritadi, Vanuatu Moliyaviy Xizmatlar Komissiyasi (VFSC) tomonidan vakolatli va tartibga solinadi, ro‘yxatga olish raqami 40356 va ro‘yxatdan o‘tgan manzili: 1276, Kumul Highway, Port Vila, Vanuatu, Vanuatu Respublikasi.
Email: support@tmgm.com
Trademax Global Markets (SE) Limited, TMGM nomi ostida faoliyat yuritadi, Seyshel orollari Moliyaviy Xizmatlar Boshqarmasi (FSA) tomonidan 224-sonli SD litsenziyasi bilan vakolatli va tartibga solinadi. Kompaniya Office No 13, Providence Estate ABIS Centre, Mahe, Seychelles manzilida ro‘yxatdan o‘tgan.
Email: support@tmgm.com
Trademax Global Markets (International) Pty Ltd, TMGM nomi ostida faoliyat yuritadi, Mauritius Moliyaviy Xizmatlar Komissiyasi (FSC) tomonidan GB22201012 litsenziya raqami bilan vakolatli va tartibga solinadi hamda 33, Edith Cavell Street C/o IQ EQ Fund Services (Mauritius) Ltd Port Louis, 11324 Mauritius manzilida ro‘yxatdan o‘tgan.
Email: support@tmgm.com
Mualliflik huquqi © TMGM. Barcha huquqlar himoyalangan