




GBP/JPY Price Forecast: Struggles at 50-day SMA with bulls near 215.50
- GBP/JPY stalls near 215.00 as buyers hesitate below 50-day SMA.
- Flat RSI at neutral signals limited conviction from both sides.
- Losses below 215.00 would expose 214.53 and deeper support.
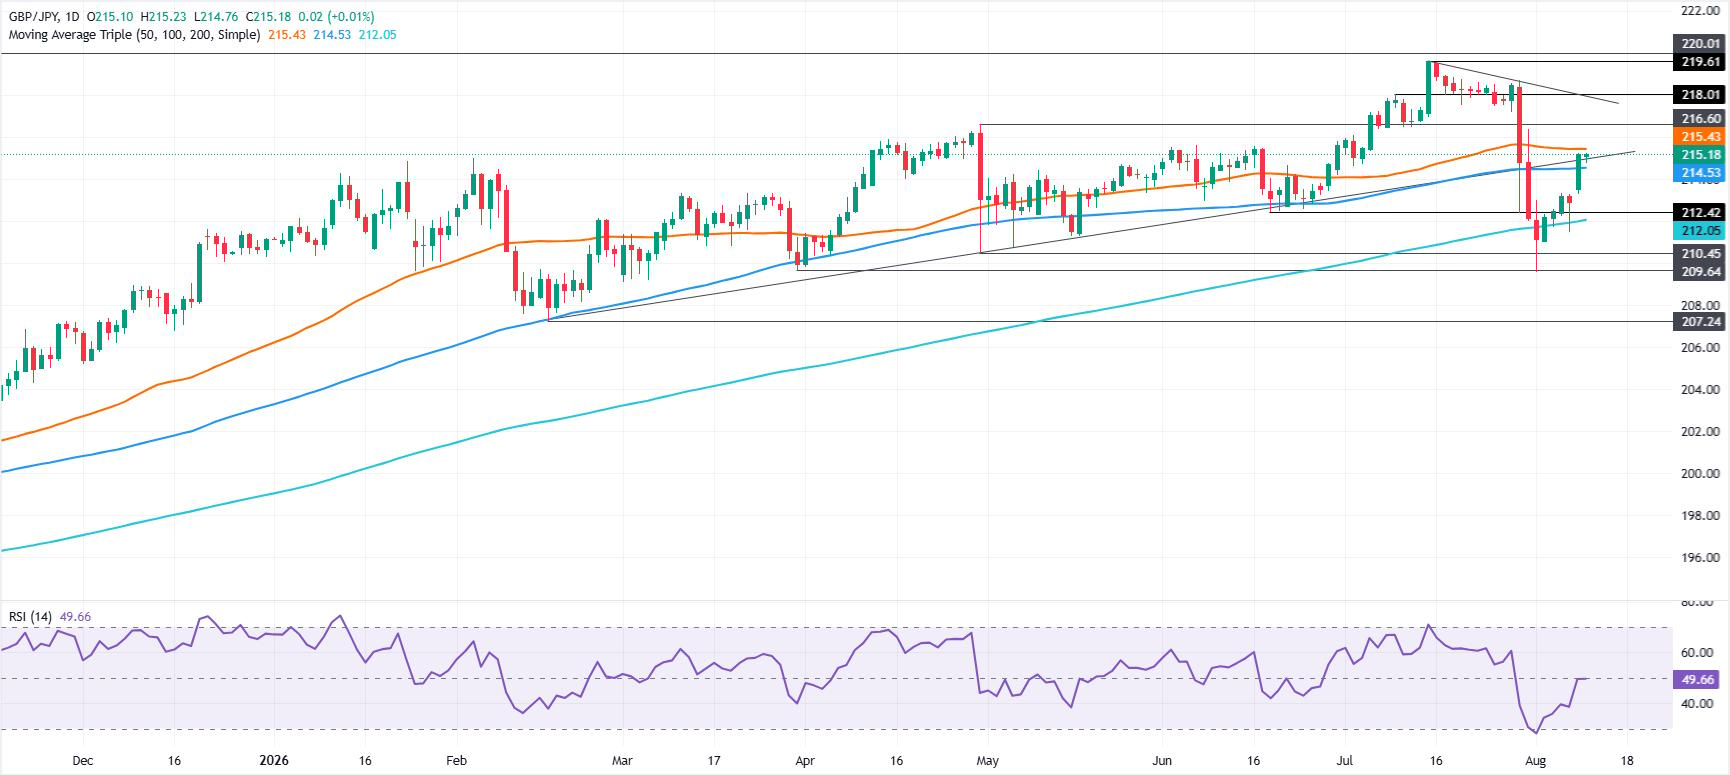
The GBP/JPY ended Tuesday’s session unchanged at 215.17 as buyers remained reluctant to test the 50-day Simple Moving Average (SMA) at 215.43, seen as the first resistance level on its way to re-test yearly peaked at around 219.61.
GBP/JPY Price Forcast: Technical outlook
Price action suggests the GBP/JPY is facing key resistance that could cap the advance, which could open the door for sideways trading. Further confirmation of this, is the Relative Strength Index (RSI): The RSI shifted flat exactly at the 50-neutral level, an indication that neither buyers nor sellers are fully committed to push the cross above or below familiar levels.

On the upside, the first key resistance is the 50-day SMA, followed by the 216.00 mark. A breach of the latter will expose the 216.50 figure, followed by the 217.00 psychological mark
Downwards, the GBP/JPY first support would be the 215.00 milestone, followed by the 100-day SMA at 214.53. Below this, sits the 200-day SMA at 217.05 ahed the August 7 low of the day (LOD) at 211.47.
GBP/JPY Price Chart – Daily
Japanese Yen FAQs
The Japanese Yen (JPY) is one of the world’s most traded currencies. Its value is broadly determined by the performance of the Japanese economy, but more specifically by the Bank of Japan’s policy, the differential between Japanese and US bond yields, or risk sentiment among traders, among other factors.
One of the Bank of Japan’s mandates is currency control, so its moves are key for the Yen. The BoJ has directly intervened in currency markets sometimes, generally to lower the value of the Yen, although it refrains from doing it often due to political concerns of its main trading partners. The BoJ ultra-loose monetary policy between 2013 and 2024 caused the Yen to depreciate against its main currency peers due to an increasing policy divergence between the Bank of Japan and other main central banks. More recently, the gradually unwinding of this ultra-loose policy has given some support to the Yen.
Over the last decade, the BoJ’s stance of sticking to ultra-loose monetary policy has led to a widening policy divergence with other central banks, particularly with the US Federal Reserve. This supported a widening of the differential between the 10-year US and Japanese bonds, which favored the US Dollar against the Japanese Yen. The BoJ decision in 2024 to gradually abandon the ultra-loose policy, coupled with interest-rate cuts in other major central banks, is narrowing this differential.
The Japanese Yen is often seen as a safe-haven investment. This means that in times of market stress, investors are more likely to put their money in the Japanese currency due to its supposed reliability and stability. Turbulent times are likely to strengthen the Yen’s value against other currencies seen as more risky to invest in.













