

Trading
Explore a wide range of markets with competitive pricing, deep liquidity, and advanced trading tools.
Learn More 
Platform
Trade seamlessly with TMGM's powerful platform, built for speed, precision, and a superior trading experience.
Learn More Trading Platform
Academy
Learn the fundamentals of trading with beginner-friendly resources, including guides, webinars, and market insights.
Learn More News & Analysis
Get real-time market updates and expert analysis to stay ahead of trading opportunities
Learn More News & Analysis
About
Learn what sets TMGM apart — our global presence, regulatory strength, and commitment to innovation in trading.
Learn More Why Choose TMGM
Sponsorship
Below 212.00: GBP/JPY Price Forecast as Doji challenges bullish conviction
- 211.77 remains GBP/JPY’s consolidation area. A doji points to increasing indecision among buyers.
- Resistance at 212.00 caps the upside, although bullish RSI momentum underpins the recovery.
- Above 212.00, a breakout brings the 200-day SMA at 212.98 and 213.43 into focus.
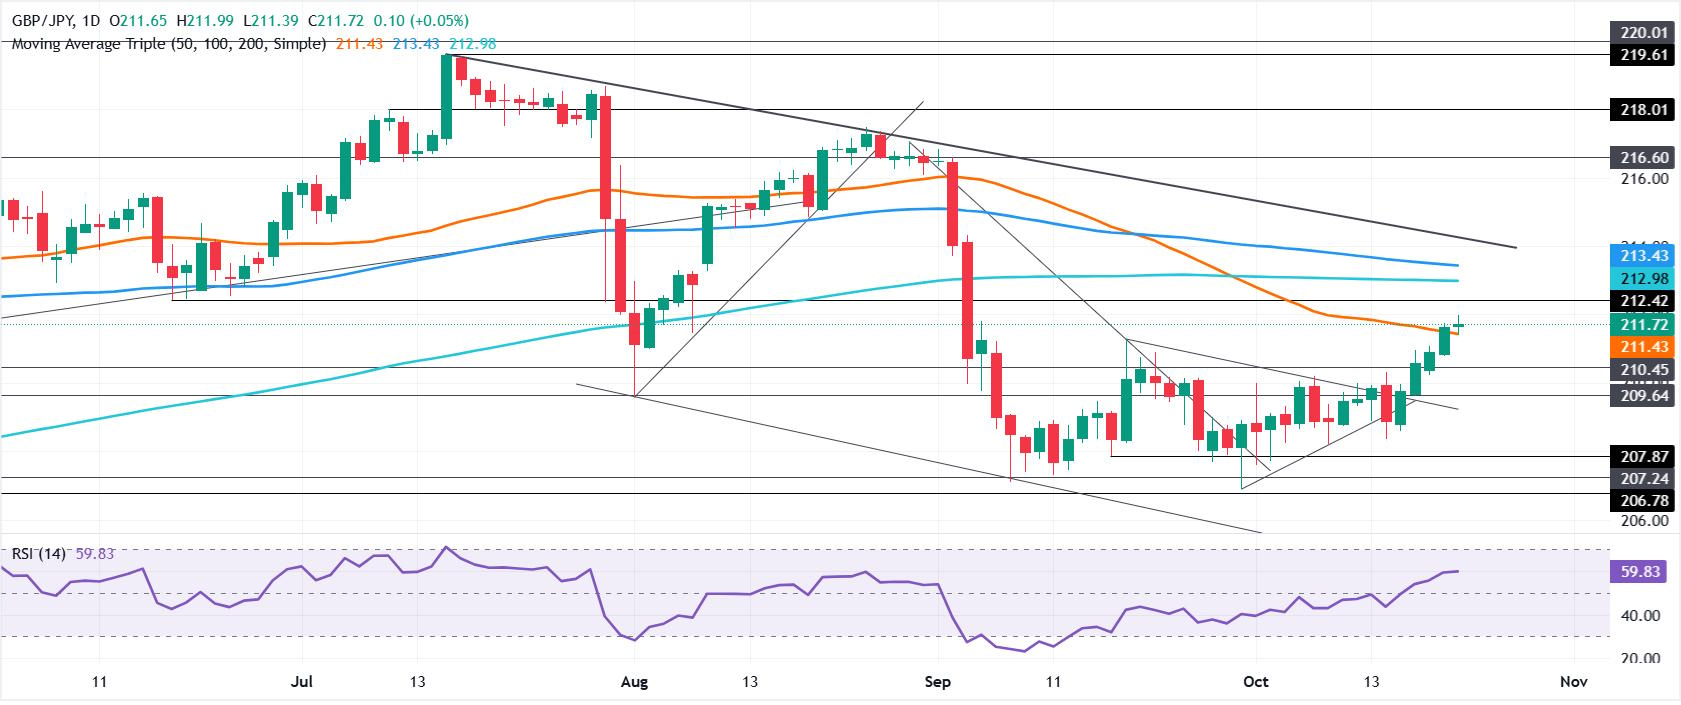
211.77 is where GBP/JPY is holding on Wednesday. Neither side has established direction after the pair broke through the 50-day Simple Moving Average (SMA) at 211.34 near the close of the 20 October session.
212.00 Resistance in Focus: GBP/JPY Technical Forecast

Despite six days of gains in GBP/JPY, a ‘doji’ formation points to a fragile uptrend. Important resistance levels lie above 212.00.
Bullish momentum is evident in the Relative Strength Index (RSI), but price action suggests buyers remain reluctant to push the pair beyond the 212.00 threshold.
Should that level give way, resistance would next come at the 200-day SMA of 212.98, ahead of the 100-day SMA at 213.43. Further gains would put 214.00 in view.
For the bearish scenario to develop, GBP/JPY would need to fall beneath the 50-day SMA, potentially bringing 211.00 into play. Losing that level would open the way to 210.00, then the 8 October swing low at 208.20 and the 30 September cycle low at 206.89.
GBP/JPY Daily Price Chart
Japanese Yen: Today’s Currency Performance
Against the Euro, the Japanese Yen recorded its strongest performance today. The table below sets out the Japanese Yen’s (JPY) percentage moves against the major currencies listed.
| USD | EUR | GBP | JPY | CAD | AUD | NZD | CHF | |
|---|---|---|---|---|---|---|---|---|
| USD | -0.00% | -0.07% | -0.06% | -0.08% | -0.39% | -0.10% | -0.04% | |
| EUR | 0.00% | -0.14% | -0.07% | -0.12% | -0.32% | -0.14% | -0.08% | |
| GBP | 0.07% | 0.14% | 0.06% | 0.00% | -0.19% | -0.01% | 0.06% | |
| JPY | 0.06% | 0.07% | -0.06% | -0.04% | -0.24% | -0.07% | 0.00% | |
| CAD | 0.08% | 0.12% | -0.01% | 0.04% | -0.21% | -0.02% | 0.04% | |
| AUD | 0.39% | 0.32% | 0.19% | 0.24% | 0.21% | 0.19% | 0.25% | |
| NZD | 0.10% | 0.14% | 0.00% | 0.07% | 0.02% | -0.19% | 0.06% | |
| CHF | 0.04% | 0.08% | -0.06% | -0.00% | -0.04% | -0.25% | -0.06% |
Percentage movements between the major currencies are displayed in the heat map. Select the base currency in the left-hand column and the quote currency in the top row. To read JPY (base)/USD (quote), for example, start with the Japanese Yen on the left and follow its row horizontally to the US Dollar column. The intersecting cell gives the percentage change for that pair.
POPULAR ARTICLES
1Bank of Japan deputy highlights inflation risk as Japanese Yen holds steady2113.50 in View: AUD/JPY Price Forecast Points to Double-Bottom Upside36.6640: UOB sees gradual Chinese Yuan gains against US Dollar4Below 212.00: GBP/JPY Price Forecast as Doji challenges bullish conviction5Euro awaits PMIs first, then France’s credit rating over the weekend6RBA hike bets double: Australian Dollar shrugs off Iran war fears7November hike already priced in as British Pound awaits retail sales83.7% YoY: New Zealand Q3 CPI Inflation Slows, Below 3.8% Expected9Indonesian Rupiah Faces Depreciation Bias Amid MSCI Risk – MUFG
LIVE QUOTES


Get Started!
Sign up and access the Global Markets in less than 3 minutes

Connect With Us









Contacts
Phone: +61 2 8036 8388
Fax: +61 2 8036 8388
Email: support@tmgm.com



The information provided on this website is of a general nature only and does not constitute personal financial advice. Before acting on any information on this website, you should consider the suitability of the information in relation to your objectives, financial situation and needs. Investing in CFDs and FX Margin Contracts carries significant risks and is not suitable for all investors. You may lose more than your initial deposit. You do not own, or have, any interest in the underlying asset. We recommend that you seek independent advice and ensure you fully understand the risks involved before trading. It is important that you read and consider the disclosure document before you acquire any product listed on the website. The information and advertisements offered on this website are not intended for use by any person in any country or jurisdiction where such use would be contrary to local laws and regulations. The Products and Services offered on this website are not intended for residents of the United States, Malaysia and Thailand.
TMGM is authorized and regulated in various jurisdictions.
Trademax Australia Limited, trading as TMGM, is regulated by the Australian Securities and Investments Commission (ASIC), AFSL no. 436416 and is located at Level 28, One International Tower, 100 Barangaroo Avenue, 2000 Sydney, NSW Australia.
Email: support@tmgm.com.au
Trademax Global Limited, trading as TMGM, is authorized and regulated by the Vanuatu Financial Services Commission (VFSC), registration number 40356 and registered at 1276, Kumul Highway, Port Vila, Vanuatu, Republic of Vanuatu.
Email: support@tmgm.com
Trademax Global Markets (SE) Limited, trading as TMGM, is authorized and regulated by the Financial Services Authority (FSA) of Seychelles, with license number SD224. The company is registered at Office No 13, Providence Estate ABIS Centre, Mahe, Seychelles.
Email: support@tmgm.com
Trademax Global Markets (International) Pty Ltd, trading as TMGM, is authorized and regulated by the Financial Services Commission, Mauritius (FSC) with license no. GB22201012, and registered at 33, Edith Cavell Street C/o IQ EQ Fund Services (Mauritius) Ltd Port Louis, 11324 Mauritius.
Email: support@tmgm.com
Copyright © TMGM. All rights reserved