

Trading
Explore a wide range of markets with competitive pricing, deep liquidity, and advanced trading tools.
Learn More 
Platform
Trade seamlessly with TMGM's powerful platform, built for speed, precision, and a superior trading experience.
Learn More Trading Platform
Academy
Learn the fundamentals of trading with beginner-friendly resources, including guides, webinars, and market insights.
Learn More News & Analysis
Get real-time market updates and expert analysis to stay ahead of trading opportunities
Learn More News & Analysis
About
Learn what sets TMGM apart — our global presence, regulatory strength, and commitment to innovation in trading.
Learn More Why Choose TMGM
Sponsorship
$61K at risk: Bitcoin faces a break below support as Ethereum pulls back and XRP consolidates | Crypto Today
- $60,000 is at risk as Bitcoin faces selling pressure on Friday. A deeper correction below that level remains possible.
- Below $1,800, Ethereum extends its decline as sellers strengthen their control.
- $0.90 to $1.00 contains XRP’s consolidation, with the token relatively steady despite the wider bearish environment.
$62,000 remains above Bitcoin (BTC) as it hovers below that level on Friday. The cryptocurrency market is seeking stability against widespread selling. Attempts by the Crypto King to recover this week have gained little momentum, keeping sellers largely in charge.

Investor repositioning is uneven across altcoins, judging by the divergent signals from Ethereum (ETH) and Ripple (XRP). ETH, the smart contract token, has extended its retreat below $1,800. By contrast, XRP remains confined to a tight $0.90-$1.00 trading band.
In an analysis report sent by email, Crypto Finance said: “Crypto markets have offered little shelter. Bitcoin slipped toward $61,000-$62,000, losing approximately 13% over the past week, while Ethereum traded around 41,700-1,800,”
12 on sentiment index: risk aversion endures
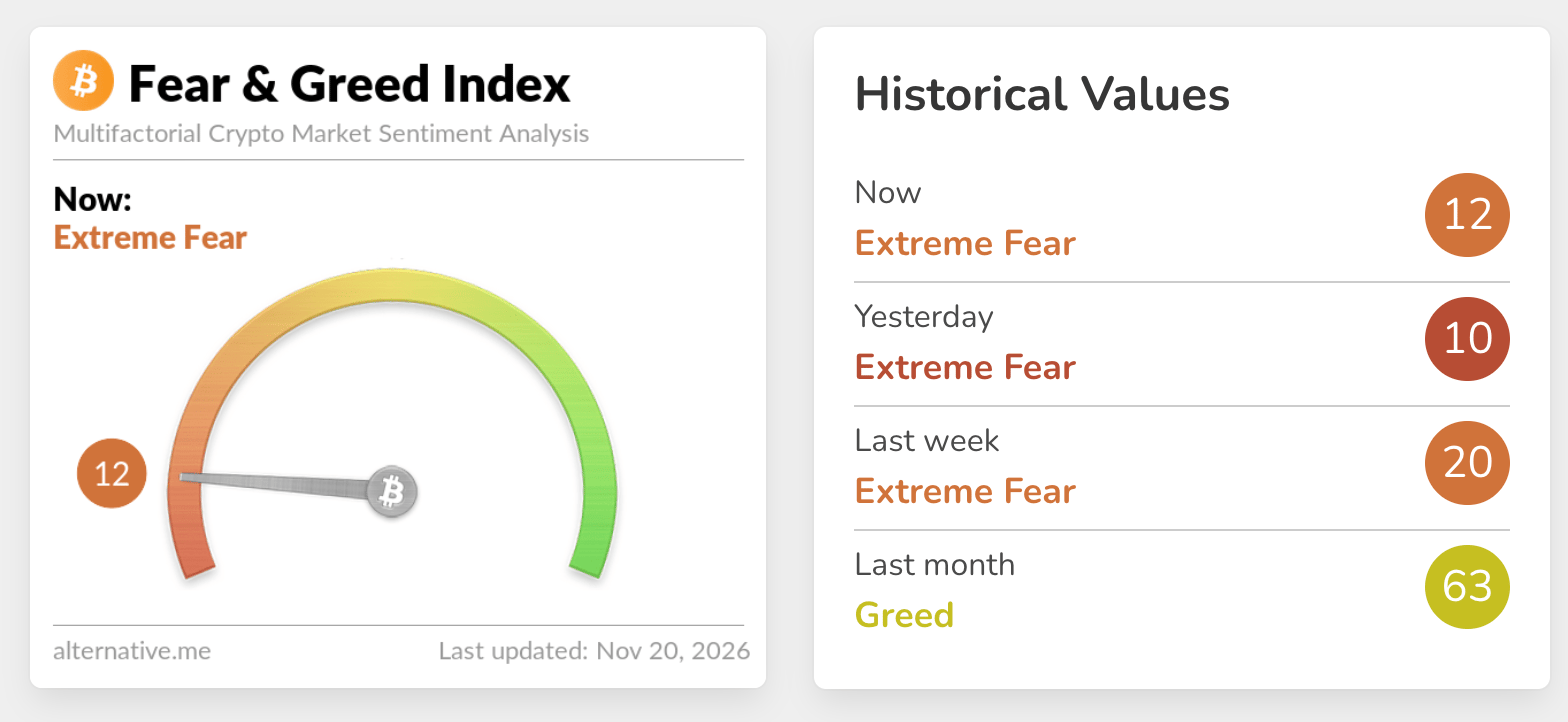
Friday’s Fear & Greed Index reading of 12 remains in Extreme Fear territory, barely above the previous day’s 10 in the same category. The figures underline dwindling demand for crypto-related assets. Investors are deliberately stepping back from the market, potentially waiting for stability to return.
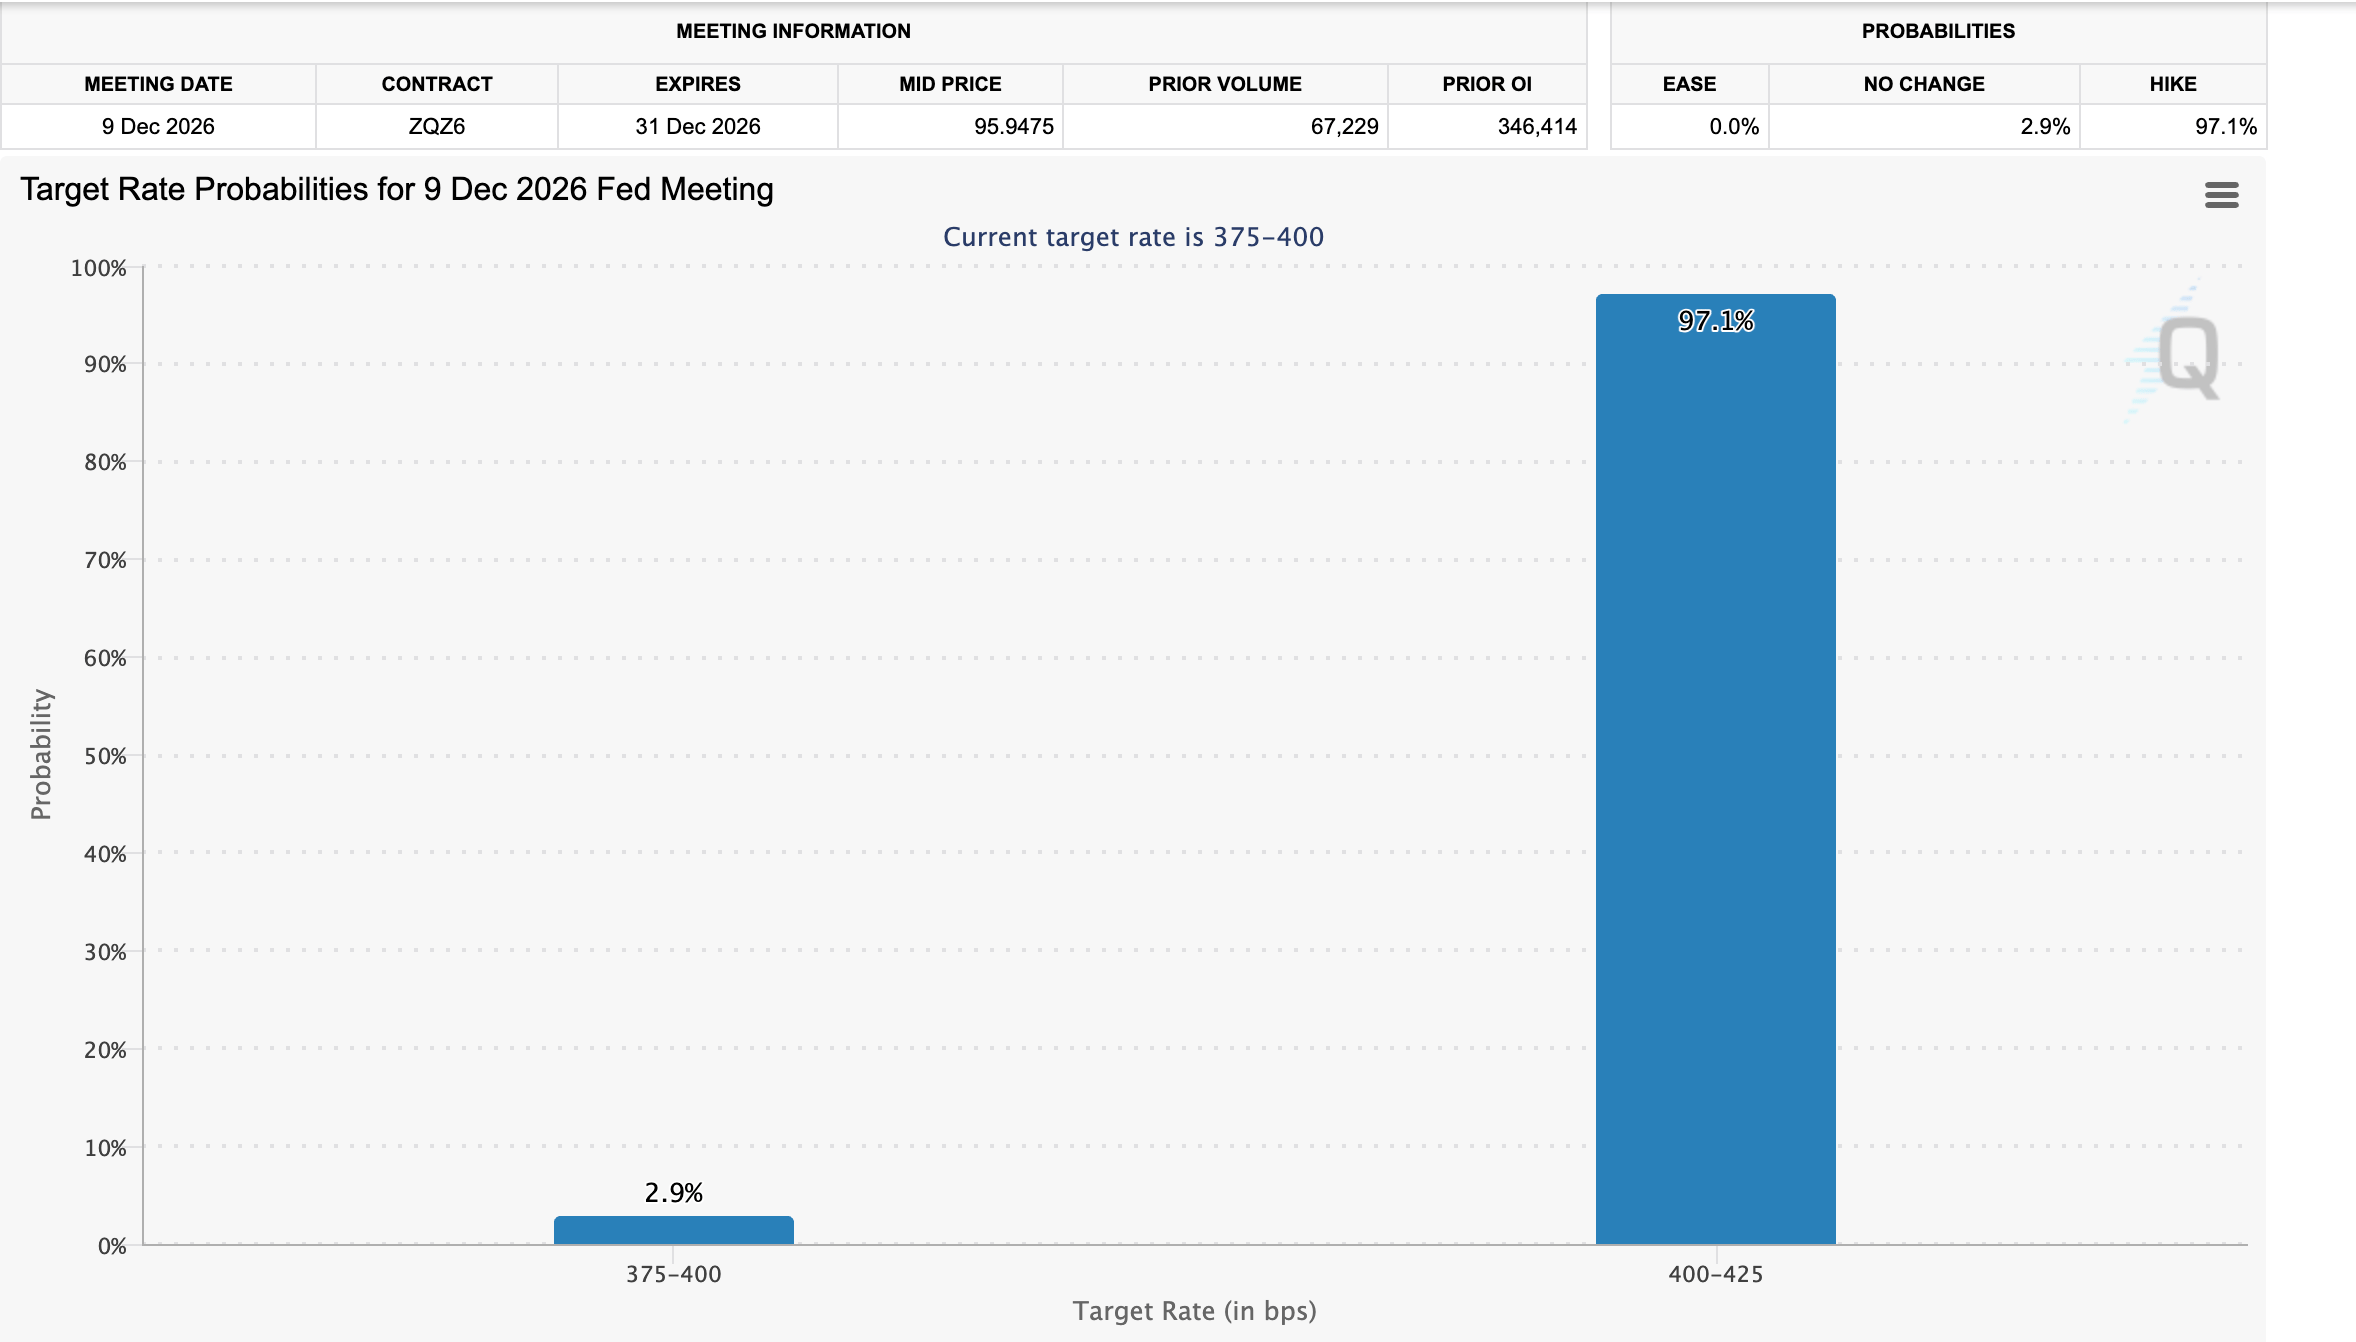
Traders nevertheless remain on edge ahead of the Federal Reserve (Fed) interest rate decision in December. Market participants are increasingly pricing in a rate rise, assigning it a 97% probability. A decision to increase rates on December 9 could take United States (US) interest rates to 4.00-4.25%, with consequences for risk assets. The tendency to favour more stable holdings, including US Treasuries, works against a risk-on shift into crypto assets.
The report also carried this assessment from Crypto Finance: “The Fed is growing increasingly concerned about inflation. Minutes from its October meeting highlighted the rapid expansion of debt financing for Artificial Intelligence (AI) infrastructure, alongside concerns about potentially disappointing investment returns,”
$61,843: Bitcoin technical outlook points to further downside
At $61,843, Bitcoin remains far below every key Exponential Moving Average (EMA), extending its decline and maintaining a firmly bearish near-term outlook. Overhead sit the 50-day EMA at $74,655, the 100-day EMA at $75,430 and the 200-day EMA at $75,653. This configuration places a firm cap on price, with rebounds likely to encounter selling as they approach those trend measures.
A Relative Strength Index reading of 20 puts momentum deep in oversold territory. Meanwhile, the Moving Average Convergence Divergence (MACD) line remains firmly below zero. Together, these indicators point to sustained downward pressure, although intermittent short-covering rallies remain a risk.
The first resistance level is the 50-day EMA around $74,655. Beyond it, the 100-day EMA at $75,430 and the 200-day EMA at $75,653 complete a concentrated supply zone. Regaining this area would be necessary to temper the bearish backdrop. The supplied daily-chart indicators offer no nearby technical support, leaving traders to look for stabilisation in price action itself. Although the oversold RSI and stretched negative MACD leave room for recovery attempts, those moves are likely to remain corrections within the prevailing downtrend while the pair stays below the EMA cluster.
$1,754: Ethereum technical outlook remains firmly bearish
At $1,754, Ethereum sits substantially below the cluster of 50-day, 100-day and 200-day EMAs spanning roughly $2,189 to $2,271. That gap preserves a clearly bearish outlook. The latest MACD reading is well below zero, while the RSI is close to 23 in oversold territory. Downward momentum therefore persists despite already stretched conditions.
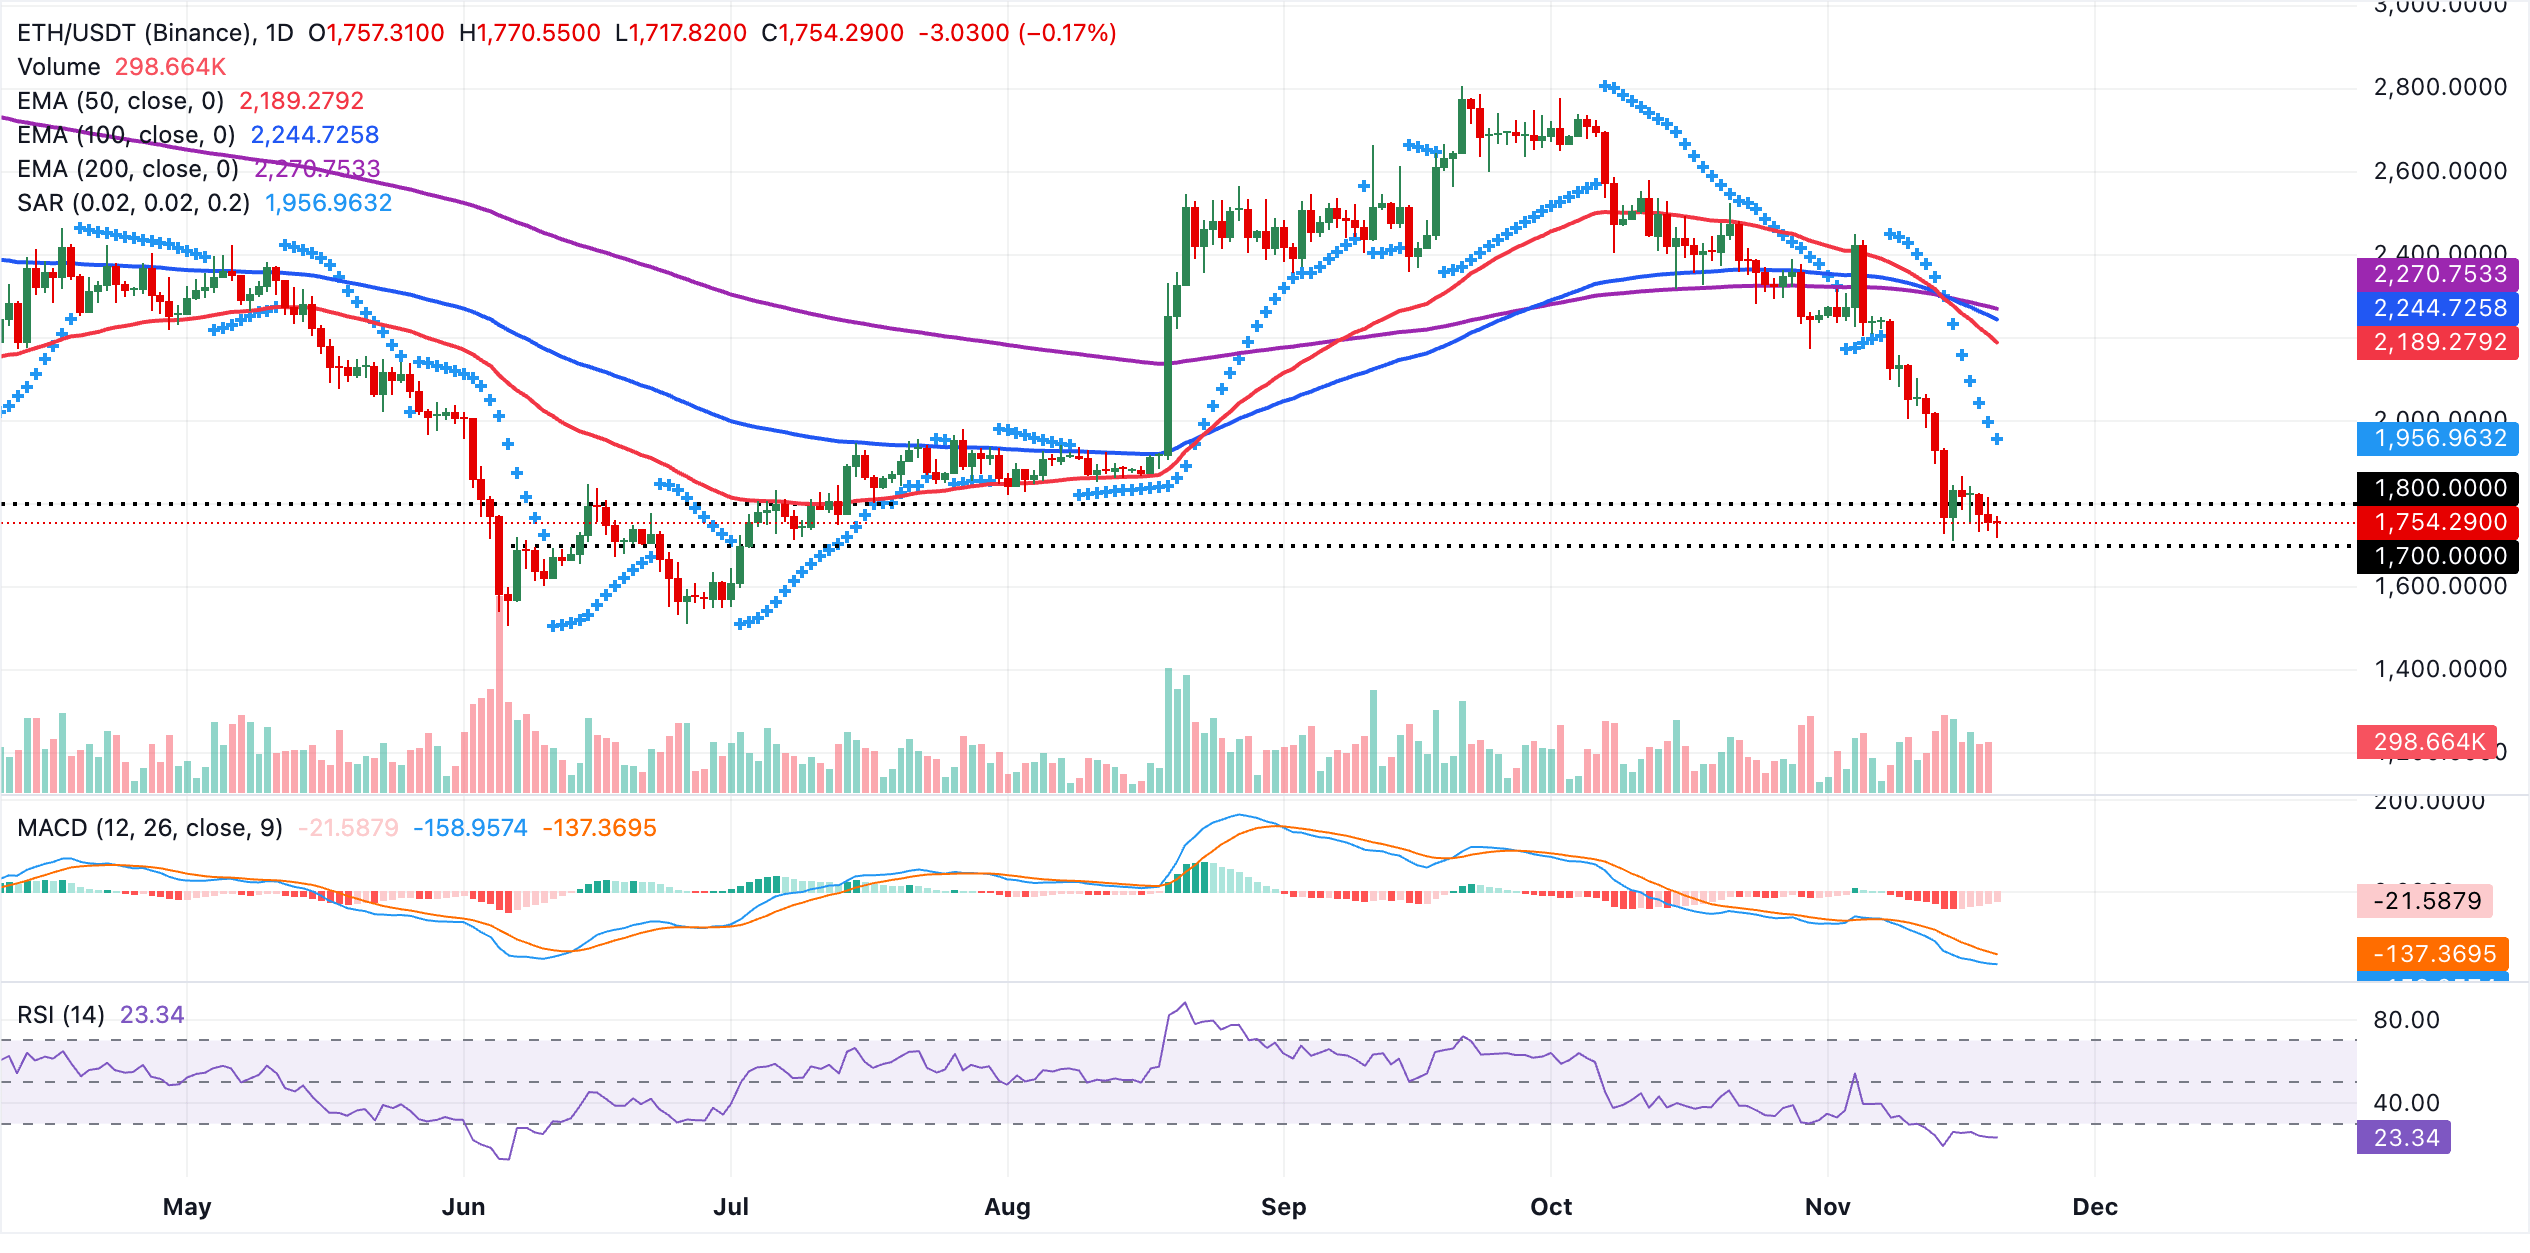
To relieve downward pressure, Ethereum would need to regain the broad supply zone formed by its key EMAs. The 50-day EMA around $2,189 provides the first resistance, followed by the 100-day EMA at $2,244 and the 200-day EMA near $2,271. For an extended decline, the Parabolic SAR around $1,957 indicates the next notable technical support, where sellers could pause or lock in profits.
$0.97: XRP technical outlook retains sideways pattern
Near $0.97, XRP remains well beneath its 50-day, 100-day and 200-day EMAs. These averages span roughly $1.19 to $1.33, keeping the medium-term structure firmly capped and the bias bearish.
Additional overhead pressure comes from the SuperTrend indicator at $1.12, also above the spot price. An RSI close to 30 indicates that conditions are moving out of oversold territory, but does not yet point to a decisive recovery. The MACD is still slightly negative, although its gradual rise towards the signal line suggests downward momentum is fading.
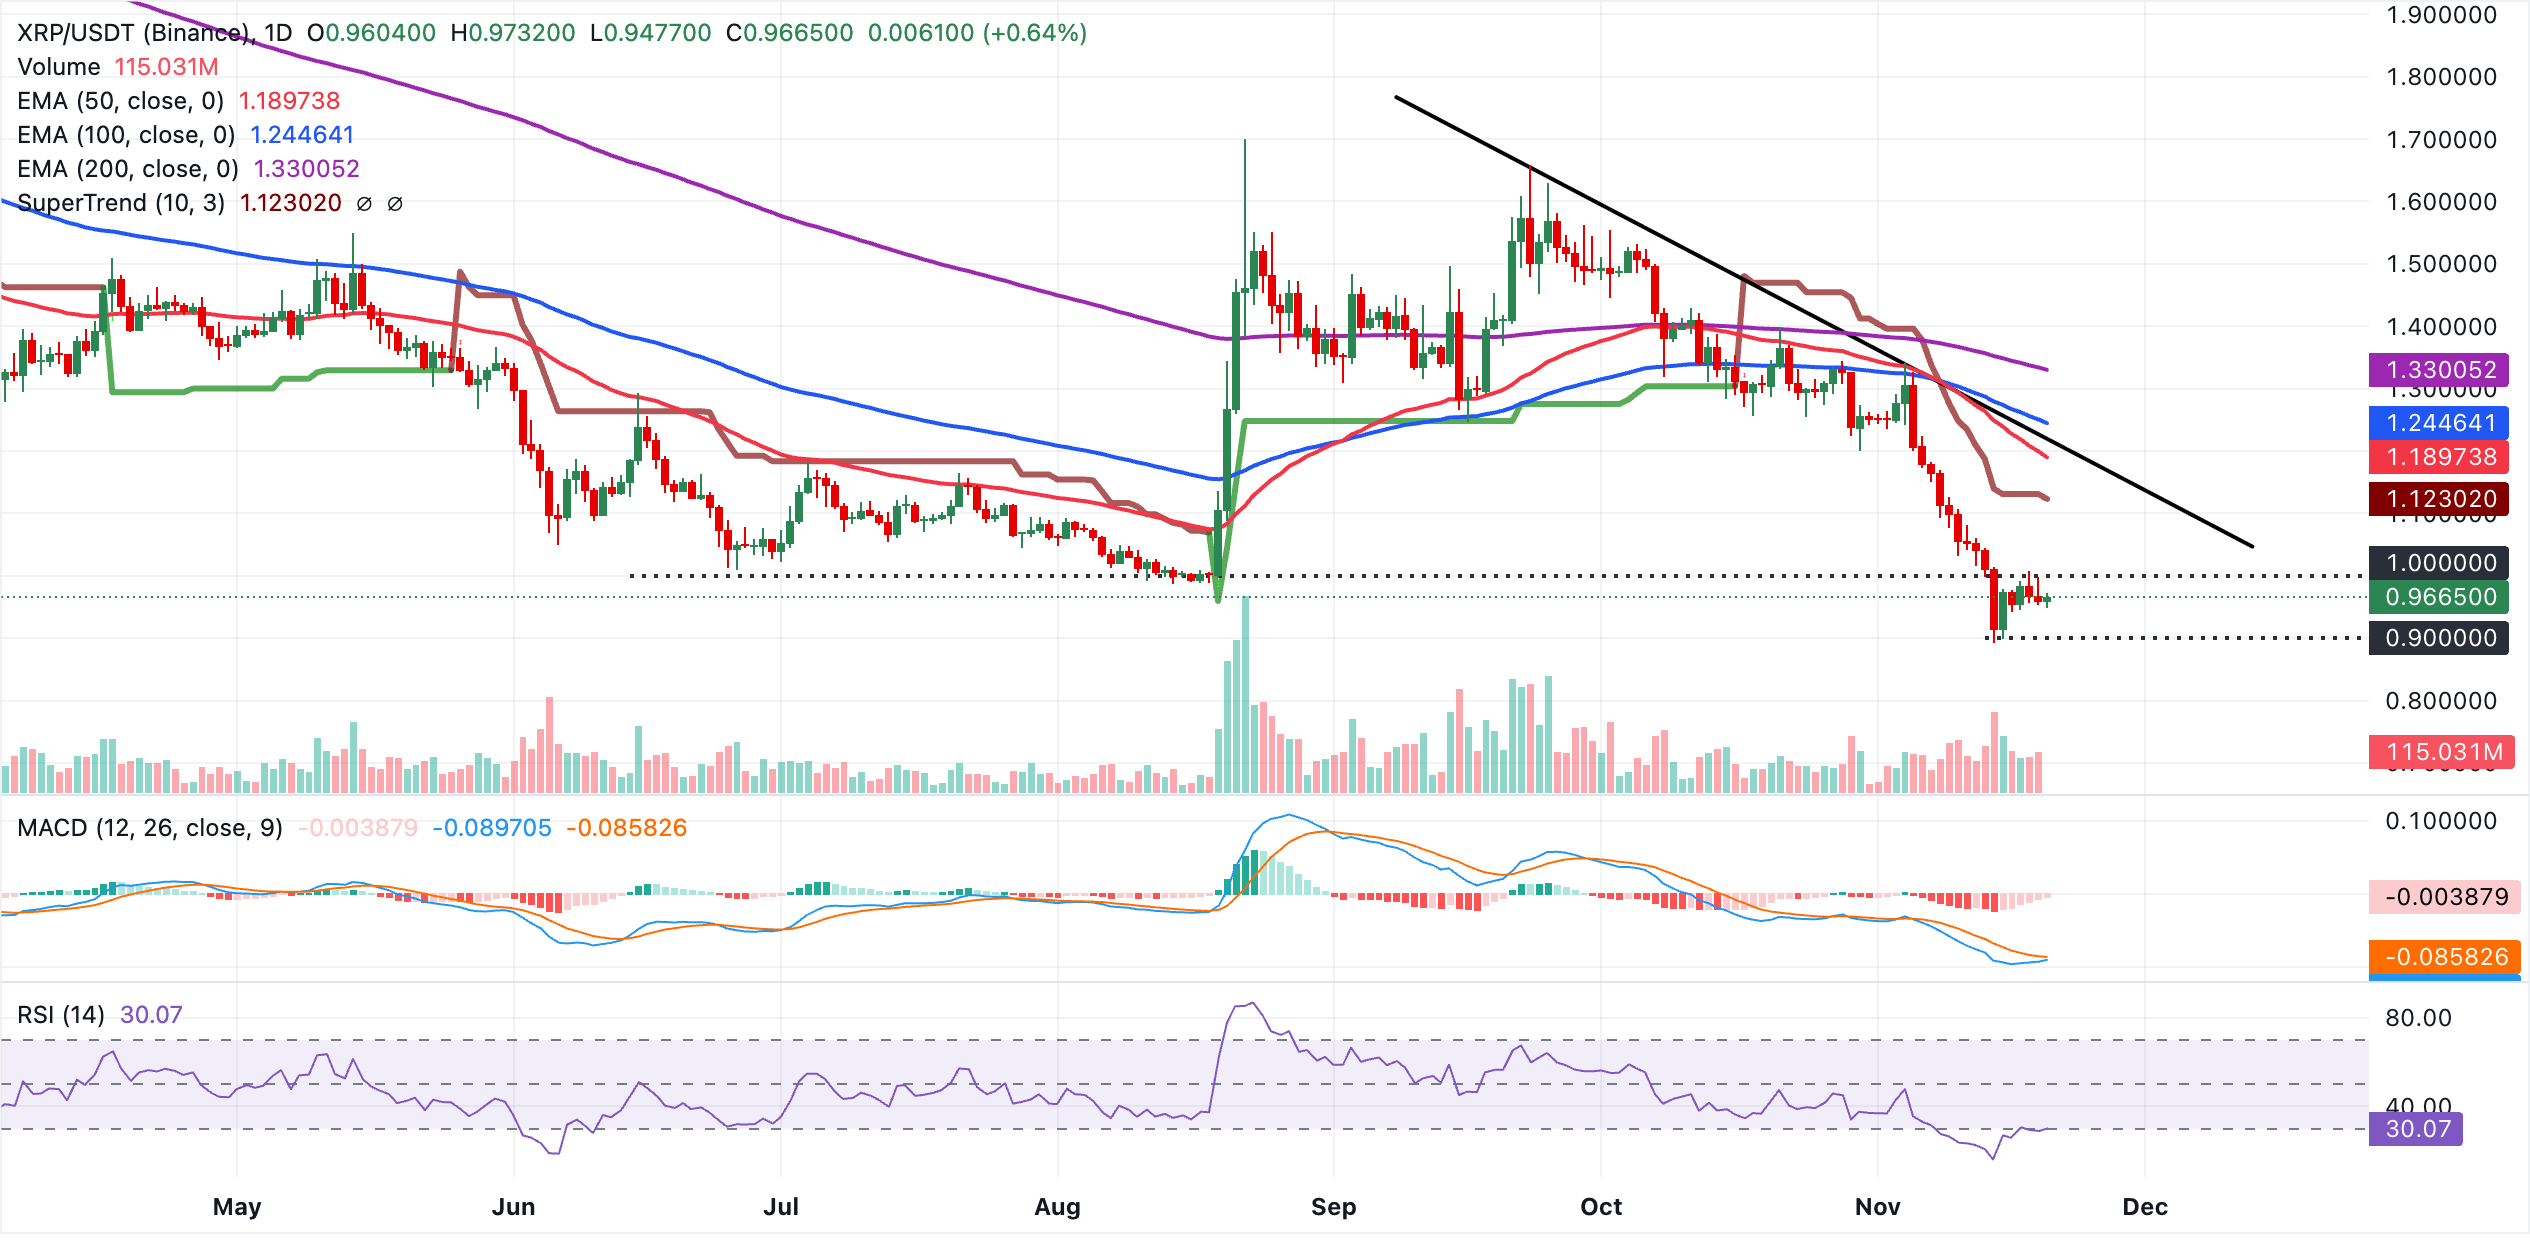
The SuperTrend reading around $1.12 is the first resistance to watch. Next come the 50-day EMA near $1.19 and the descending resistance trendline projected at about $1.22. Further above, the 100-day EMA at $1.24 and the 200-day EMA close to $1.33 remain broader bearish reference points.
Neither the moving averages nor structural levels on the daily chart provide clear technical support. As long as price stays beneath this concentrated ceiling of daily resistance indicators, rebound attempts are likely to be viewed as corrective rather than a change in trend.
(The technical analysis of this story was written with the help of an AI tool. Know more.)
Cryptocurrency prices: common questions
Demand and adoption among market participants can be shaped by token launches. When an asset gains a crypto exchange listing, its liquidity deepens and new participants join its network. For a digital asset, these developments are generally bullish.
In a hack, an attacker uses exploits, bugs or other methods to seize a large quantity of an asset from a DeFi bridge, an exchange’s hot wallet or another crypto platform. The stolen tokens are then moved off exchange platforms, ultimately to be sold or swapped for other cryptocurrencies or stablecoins. Widespread panic often follows such incidents, triggering a sell-off in the assets affected.
The direct effect on the US Dollar is the main channel through which macroeconomic events, including US Federal Reserve interest rate decisions, influence crypto assets. Higher rates generally weigh on Bitcoin and altcoin prices, while lower rates tend to have the opposite effect. A fall in the US Dollar index makes risk assets and the leverage used to trade them cheaper, thereby lifting crypto prices.
By cutting miners’ block rewards in half, halvings restrict an asset’s supply and are therefore generally viewed as bullish. With demand unchanged, a reduction in supply pushes the asset’s price higher.
POPULAR ARTICLES
1$61K at risk: Bitcoin faces a break below support as Ethereum pulls back and XRP consolidates | Crypto Today2British Pound: EU deals offer limited upside against Euro - ING30.6640 break may trigger further Australian Dollar losses - UOB4Silver price today: FXStreet data show a decline5US Dollar: USD finds support in safe-haven demand and hawkish Fed risks – OCBC6Rising inflation reinforces BoJ tightening path: Japanese Yen – Commerzbank7158.90 in Focus: USD/JPY Price Forecast as US Dollar Nears Key Support Area8Third consecutive weekly loss looms for Australian Dollar against US Dollar9Equities: Losses mount as sell-off broadens – Deutsche Bank


Get Started!
Sign up and access the Global Markets in less than 3 minutes

Connect With Us









Contacts
Phone: +61 2 8036 8388
Fax: +61 2 8036 8388
Email: support@tmgm.com



The information provided on this website is of a general nature only and does not constitute personal financial advice. Before acting on any information on this website, you should consider the suitability of the information in relation to your objectives, financial situation and needs. Investing in CFDs and FX Margin Contracts carries significant risks and is not suitable for all investors. You may lose more than your initial deposit. You do not own, or have, any interest in the underlying asset. We recommend that you seek independent advice and ensure you fully understand the risks involved before trading. It is important that you read and consider the disclosure document before you acquire any product listed on the website. The information and advertisements offered on this website are not intended for use by any person in any country or jurisdiction where such use would be contrary to local laws and regulations. The Products and Services offered on this website are not intended for residents of the United States, Malaysia and Thailand.
TMGM is authorized and regulated in various jurisdictions.
Trademax Australia Limited, trading as TMGM, is regulated by the Australian Securities and Investments Commission (ASIC), AFSL no. 436416 and is located at Level 28, One International Tower, 100 Barangaroo Avenue, 2000 Sydney, NSW Australia.
Email: support@tmgm.com.au
Trademax Global Limited, trading as TMGM, is authorized and regulated by the Vanuatu Financial Services Commission (VFSC), registration number 40356 and registered at 1276, Kumul Highway, Port Vila, Vanuatu, Republic of Vanuatu.
Email: support@tmgm.com
Trademax Global Markets (SE) Limited, trading as TMGM, is authorized and regulated by the Financial Services Authority (FSA) of Seychelles, with license number SD224. The company is registered at Office No 13, Providence Estate ABIS Centre, Mahe, Seychelles.
Email: support@tmgm.com
Trademax Global Markets (International) Pty Ltd, trading as TMGM, is authorized and regulated by the Financial Services Commission, Mauritius (FSC) with license no. GB22201012, and registered at 33, Edith Cavell Street C/o IQ EQ Fund Services (Mauritius) Ltd Port Louis, 11324 Mauritius.
Email: support@tmgm.com
Copyright © TMGM. All rights reserved