

Dow Jones Industrial Average rebounds as Crude Oil and bond yields fall
- DJIA rebounds above 51,800 after Wednesday's three-month low as Crude Oil falls.
- Six technology companies in the index carry 18.9% of it between them.
- Futures put no chance on the Fed's rate still being 3.75-4.00% after December 9.
The Dow Jones Industrial Average trades above 51,800, back over the 51,500 area it sold through on Wednesday, when the Federal Reserve raised its rate for the first time in three years and the index fell to its lowest level in three months. Crude Oil is cheaper, the 10-year Treasury yield is back under 5%, and the index has recovered about half of Wednesday's fall. The buying is concentrated in the stocks this index owns the least of.
The Dow pays by the share price, not by the company
This index weights its 30 members by what a share costs rather than by the size of the business. Nvidia (NVDA) trades near $212 and carries 2.4% of the daily movement. Caterpillar (CAT) trades near $784 and carries 8.9%, so the same percentage move in the machinery maker is worth nearly four times that move in the most valuable company in the world. Goldman Sachs (GS) at about $977 a share carries 11.1% on its own, and the five most expensive shares control 34.3% of the daily movement between them.
That is why a rally in artificial intelligence reaches the S&P 500 and the Nasdaq Composite before it reaches this one. Those two weight by the size of the business, and six technology companies hold 18.9% of the Dow against 27.5% for five financial companies. The chipmakers that led the move are not in the index at all, and Intel (INTC) stopped being in it when Nvidia replaced it in 2024.
Saudi Arabia did more for the index than the Fed did
Crude Oil trades back under $100 a barrel and Brent near $102, both lower, after Saudi Arabia offered Asian refiners extra cargoes through ship-to-ship transfers off Oman's Sohar port. Chevron (CVX) has been the index's only energy company since 2020 and carries 2.5% of it, so a cheaper barrel costs the Dow one stock and pays the other 29 through fuel, freight and packaging. The transfers are a workaround rather than a peace, in the seventh month of a war that put Crude Oil above $100 in the first place.
The 10-year Treasury yield is back under 5%, a level it had climbed above again on Wednesday after the decision. So the Fed raised the rate banks charge each other overnight, and the rate that prices a mortgage went down instead. Home Depot (HD) and Sherwin-Williams (SHW) carry 7.2% of the index between them, more than Nvidia and Amazon (AMZN) combined, and they sell into whatever the 10-year does next.
The data made the second increase easier
First-time claims for unemployment benefits came in at 196K against a 208K forecast and a previous 206K. The Philadelphia Fed's factory survey came in at 37.8 against a 30.5 forecast. Neither number describes an economy that one rate increase has already slowed, and Fed Chair Warsh said after the decision that inflation is too high and has been so for too long. Sixteen of the 18 officials who submit rate forecasts expect another increase this year, and four of them expect two.
Housing went the other way. Starts came in at 1.275 million against a 1.31 million forecast, building permits at 1.394 million against 1.41 million, and both were below July. Pending home sales rose 0.3% against a 2% forecast. Housing is the part of the economy that higher rates have already reached, and it arrives here through the two companies that sell the paint and the lumber.
One session after the first increase in three years, futures put no chance at all on the Fed's rate still being 3.75-4.00% after the December 9 meeting, and slightly better than even odds that the next one lands on October 28. The path they price runs to 4.50-4.75% by the middle of 2027, three more increases on top of Wednesday's. Caterpillar lends its customers the money to buy its machines through its own finance arm, so a rate walking that far reaches the index's second-heaviest stock twice.
Industrial production is released Friday at 13:15 GMT, forecast at 0.3% against 0.2% in July, and Honeywell (HON) and 3M (MMM) are where that number lands in this index. Fed Governor Bowman speaks at 07:30 GMT.
Levels and bias
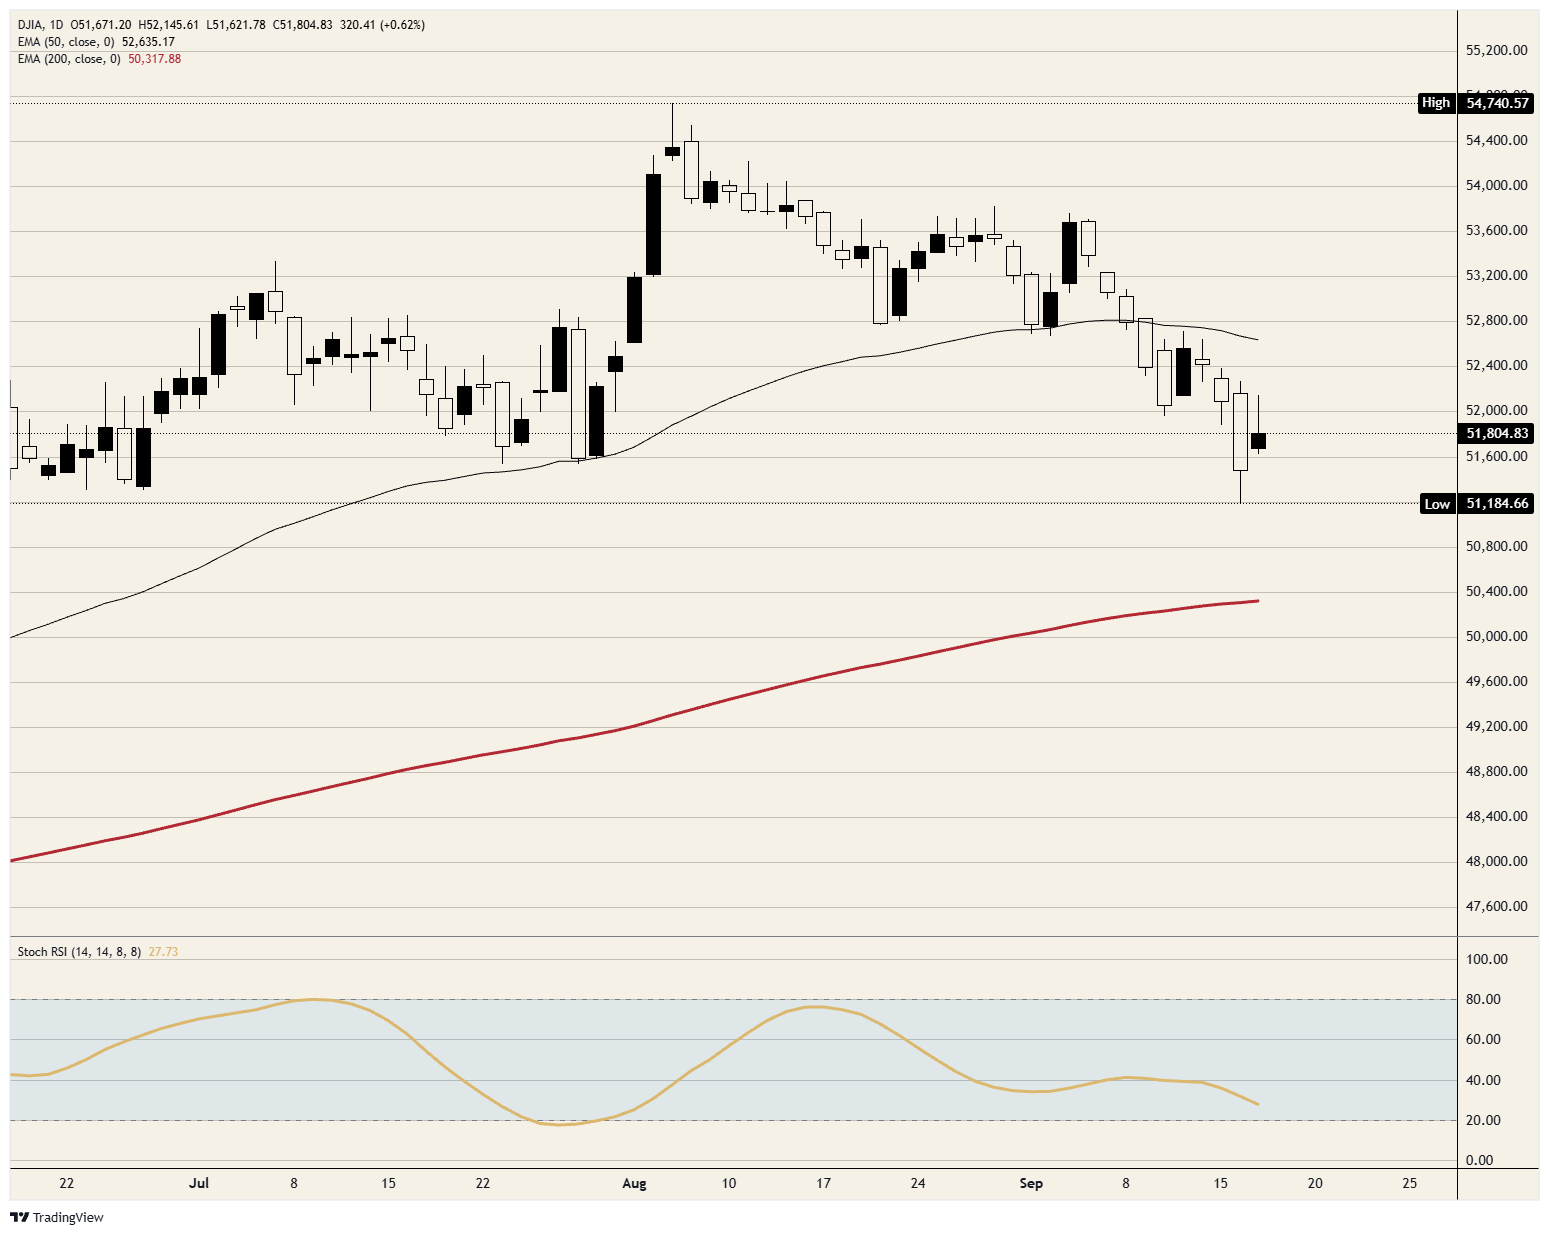
Resistance: The session high just above 52,100 is where the bounce stopped, and the 50-day Exponential Moving Average (EMA) near 52,600 is the cap above it. The index has not been above that average since early September and the average has turned down.
Support: The session low near 51,600 is the first floor. Beneath it, 51,500 is the shelf that gave way on Wednesday, and Wednesday's low near 51,200 is the three-month low the bounce started from.
Bias: Bearish while the 50-day average near 52,600 caps the recovery. The first objective is 51,500 and the second is Wednesday's low near 51,200. The daily Stochastic Relative Strength Index (Stoch RSI), a momentum gauge, is near 28 and still falling, so the bounce has not turned the trend. A daily close above 52,600 ends the bearish case.
Dow Jones daily chart
Dow Jones FAQs
The Dow Jones Industrial Average, one of the oldest stock market indices in the world, is compiled of the 30 most traded stocks in the US. The index is price-weighted rather than weighted by capitalization. It is calculated by summing the prices of the constituent stocks and dividing them by a factor, currently 0.152. The index was founded by Charles Dow, who also founded the Wall Street Journal. In later years it has been criticized for not being broadly representative enough because it only tracks 30 conglomerates, unlike broader indices such as the S&P 500.
Many different factors drive the Dow Jones Industrial Average (DJIA). The aggregate performance of the component companies revealed in quarterly company earnings reports is the main one. US and global macroeconomic data also contributes as it impacts on investor sentiment. The level of interest rates, set by the Federal Reserve (Fed), also influences the DJIA as it affects the cost of credit, on which many corporations are heavily reliant. Therefore, inflation can be a major driver as well as other metrics which impact the Fed decisions.
Dow Theory is a method for identifying the primary trend of the stock market developed by Charles Dow. A key step is to compare the direction of the Dow Jones Industrial Average (DJIA) and the Dow Jones Transportation Average (DJTA) and only follow trends where both are moving in the same direction. Volume is a confirmatory criteria. The theory uses elements of peak and trough analysis. Dow’s theory posits three trend phases: accumulation, when smart money starts buying or selling; public participation, when the wider public joins in; and distribution, when the smart money exits.
There are a number of ways to trade the DJIA. One is to use ETFs which allow investors to trade the DJIA as a single security, rather than having to buy shares in all 30 constituent companies. A leading example is the SPDR Dow Jones Industrial Average ETF (DIA). DJIA futures contracts enable traders to speculate on the future value of the index and Options provide the right, but not the obligation, to buy or sell the index at a predetermined price in the future. Mutual funds enable investors to buy a share of a diversified portfolio of DJIA stocks thus providing exposure to the overall index.














