

Trading
Explore a wide range of markets with competitive pricing, deep liquidity, and advanced trading tools.
Learn More 
Platform
Trade seamlessly with TMGM's powerful platform, built for speed, precision, and a superior trading experience.
Learn More Trading Platform
Academy
Learn the fundamentals of trading with beginner-friendly resources, including guides, webinars, and market insights.
Learn More News & Analysis
Get real-time market updates and expert analysis to stay ahead of trading opportunities
Learn More News & Analysis
About
Learn what sets TMGM apart — our global presence, regulatory strength, and commitment to innovation in trading.
Learn More Why Choose TMGM
Sponsorship
Bitcoin reclaims key moving averages, altering bear cycle pattern — K33
- Bitcoin reclaimed its 50-day, 100-day, 200-day and 200-week moving averages, a structure historically associated with cycle bottoms.
- The top crypto's recent 54% drawdown is shallower than the 77.5%-85% declines recorded in previous bear markets.
- Bitcoin ETPs absorbed more than 14,000 BTC after the cryptocurrency broke above its ETF cost basis for the first time since January.
Bitcoin (BTC) may have altered its bear-cycle pattern after climbing above its 50-day, 100-day, 200-day, and 200-week moving averages, according to K33.
In a Tuesday report, K33 noted that every time Bitcoin reclaimed all four major averages before now, it happened after the market had already established its cycle low.
“Every instance prior to 2026 occurred after BTC had already made its cycle low, with BTC subsequently pushing higher with solid momentum after reclaiming its major moving averages,” K33 wrote.
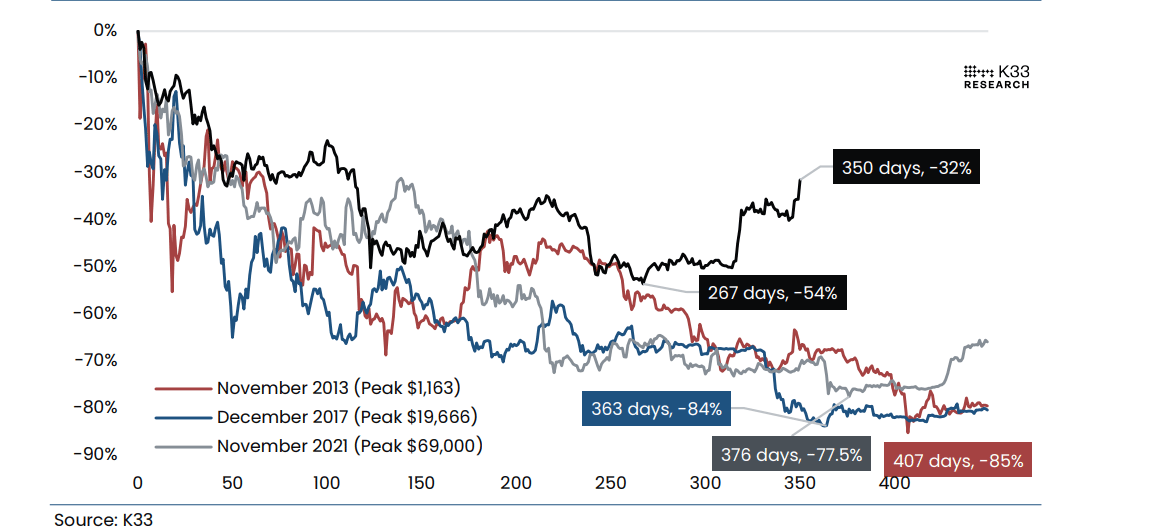
Bitcoin remains 32% below its October 6 all-time high of $126,296, but the recent drawdown reached a 54% decline from that peak before a subsequent recovery. In contrast, the three previous drawdowns in 2013, 2017 and 2021, which lasted between 363 and 407 days, produced declines ranging from 77.5% to 85%. The report also said 50% of Bitcoin's supply traded at a loss faster than in previous market downturns.
K33 shared that neither recent derivatives positioning nor market sentiment currently indicates meaningful near-term downside risk.
“Neither recent changes in derivatives nor sentiment point to meaningful downside risks in the near term, while BTC still has considerable catch-up potential versus gold and equities amid a favorable broader backup,” K33 wrote.
Bitcoin ETF flows signal stronger external demand
On the institutional side, Bitcoin moved above the average entry price of US spot BTC exchange-traded funds (ETFs) for the first time since January, ending a record 236-day period below the ETF cost basis. The move was accompanied by more than 14,000 BTC entering into Bitcoin products on Monday.
“The recent behavioral pattern of ETF investors adding to BTC near the cost basis rather than exiting is very encouraging,” K33 wrote.
In May, Bitcoin approached the ETF cost basis but was rejected. That episode was followed by 127,900 BTC in ETF redemptions over seven weeks, marking the worst Bitcoin ETF outflow period on record. This time, Bitcoin spent roughly four weeks near the ETF cost basis without triggering comparable selling. Flows remained marginally positive before accelerating after the breakout. K33 added that 63% of trading days over the past 30 days recorded net inflows, while total Bitcoin ETP holdings remain about 99,000 BTC below their previous peak.
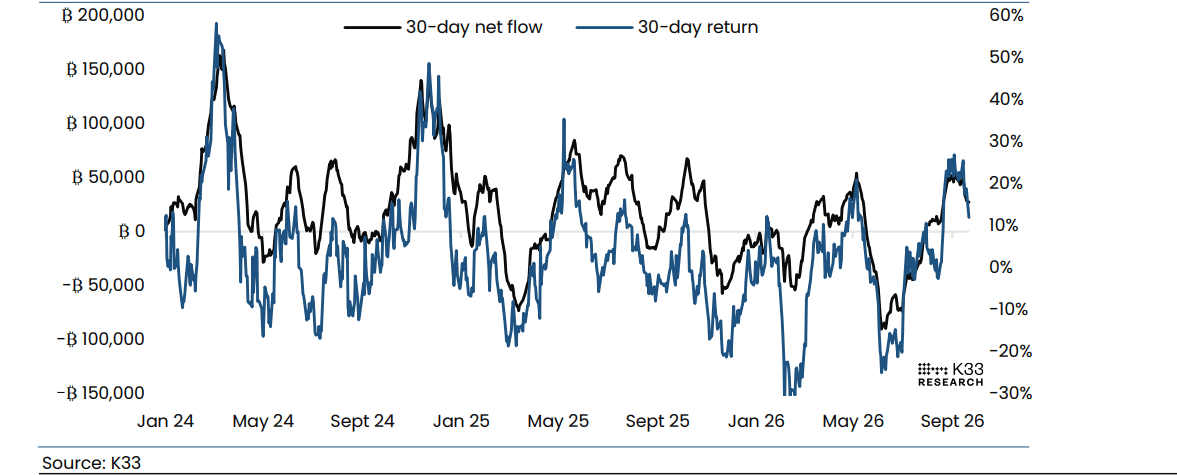
The improvement across spot Bitcoin ETF products has been accompanied by higher market activity. K33 reported that average daily Bitcoin spot volume increased to $3.5 billion from $2.6 billion last week.
Seven-day Bitcoin volatility has also risen to 3.5%, approaching monthly highs, while 30-day volatility stands at 2.2%.
The report also highlighted that Bitcoin’s Fear and Greed Index had entered extreme greed territory at 78, its first move into that zone since 2025.
Bitcoin is trading at $86,400, up 0.7% in the past 24 hours at the time of writing.
Top Articles
1Banxico expected to stay put as inflation risks block easing – Reuters2ECB’s Nagel says restrictive policy cannot be ruled out3South Korean Won: Export surge supports BoK stance – Commerzbank4Mexican Peso carry cushion thins as USD/MXN breaks 100-day SMA5Bitcoin reclaims key moving averages, altering bear cycle pattern — K336Taiwan Dollar: Equity inflows support TWD againt US Dollar – OCBC7Gold losses altitude as peace hopes meet hawkish Fed bets8Asia FX: AI-driven support for regional currencies – MUFG9Forex Today: Advanced PMIs in the limelight, but what about the UN General Assembly?
LIVE QUOTES


ALL ABOUT TECHNICAL
What Is the Dark Cloud Cover Pattern and How Do You Trade It?
What Is the Piercing Line Candlestick Pattern and How Do You Trade It?
What Are Tweezer Top and Bottom Candlestick Patterns?
Inside Bar Candlestick Pattern: What It Is, How to Identify It, and How to Trade It
Hanging Man Candlestick Pattern: How to Identify and Trade It
VWMA vs VWAP: Key Differences, Formulas and Which to Use
What Is Volume-Weighted Average Price (VWAP)? Formula, Settings and Strategies
Volume Weighted Moving Average (VWMA): Formula, Signals, and Strategy
Double Exponential Moving Average: How It Works & How to Use It
Get Started!
Sign up and access the Global Markets in less than 3 minutes

Connect With Us









Contacts
Phone: +61 2 8036 8388
Fax: +61 2 8036 8388
Email: support@tmgm.com



The information provided on this website is of a general nature only and does not constitute personal financial advice. Before acting on any information on this website, you should consider the suitability of the information in relation to your objectives, financial situation and needs. Investing in CFDs and FX Margin Contracts carries significant risks and is not suitable for all investors. You may lose more than your initial deposit. You do not own, or have, any interest in the underlying asset. We recommend that you seek independent advice and ensure you fully understand the risks involved before trading. It is important that you read and consider the disclosure document before you acquire any product listed on the website. The information and advertisements offered on this website are not intended for use by any person in any country or jurisdiction where such use would be contrary to local laws and regulations. The Products and Services offered on this website are not intended for residents of the United States, Malaysia and Thailand.
TMGM is authorized and regulated in various jurisdictions.
Trademax Australia Limited, trading as TMGM, is regulated by the Australian Securities and Investments Commission (ASIC), AFSL no. 436416 and is located at Level 28, One International Tower, 100 Barangaroo Avenue, 2000 Sydney, NSW Australia.
Email: support@tmgm.com.au
Trademax Global Limited, trading as TMGM, is authorized and regulated by the Vanuatu Financial Services Commission (VFSC), registration number 40356 and registered at 1276, Kumul Highway, Port Vila, Vanuatu, Republic of Vanuatu.
Email: support@tmgm.com
Trademax Global Markets (SE) Limited, trading as TMGM, is authorized and regulated by the Financial Services Authority (FSA) of Seychelles, with license number SD224. The company is registered at Office No 13, Providence Estate ABIS Centre, Mahe, Seychelles.
Email: support@tmgm.com
Trademax Global Markets (International) Pty Ltd, trading as TMGM, is authorized and regulated by the Financial Services Commission, Mauritius (FSC) with license no. GB22201012, and registered at 33, Edith Cavell Street C/o IQ EQ Fund Services (Mauritius) Ltd Port Louis, 11324 Mauritius.
Email: support@tmgm.com
Copyright © TMGM. All rights reserved