

Trading
Explore a wide range of markets with competitive pricing, deep liquidity, and advanced trading tools.
Learn More 
Platform
Trade seamlessly with TMGM's powerful platform, built for speed, precision, and a superior trading experience.
Learn More Trading Platform
Academy
Learn the fundamentals of trading with beginner-friendly resources, including guides, webinars, and market insights.
Learn More News & Analysis
Get real-time market updates and expert analysis to stay ahead of trading opportunities
Learn More News & Analysis
About
Learn what sets TMGM apart — our global presence, regulatory strength, and commitment to innovation in trading.
Learn More Why Choose TMGM
Sponsorship
Ripple Price Forecast: Is Muted Retail and Institutional Demand Capping XRP Upside Below $1.00?
- Range-bound trading persists in XRP, with $0.90 marking the lower boundary and $1.00 the upper boundary.
- Weakening ETF and retail demand weighs on XRP’s recovery prospects as futures Open Interest stands at 1.95 billion XRP.
- A rise in the RSI out of oversold territory lends technical support to the initial stages of XRP’s recovery.
Recovery momentum is slowly building in Ripple (XRP) on Thursday, although the token remains confined between support at $0.90 and immediate psychological support at $1.00. Downside remains the dominant risk, but continued dip-buying in the spot market is likely to lay the foundation for a more sustained recovery.

Could persistent XRP capital outflows trigger another decline?
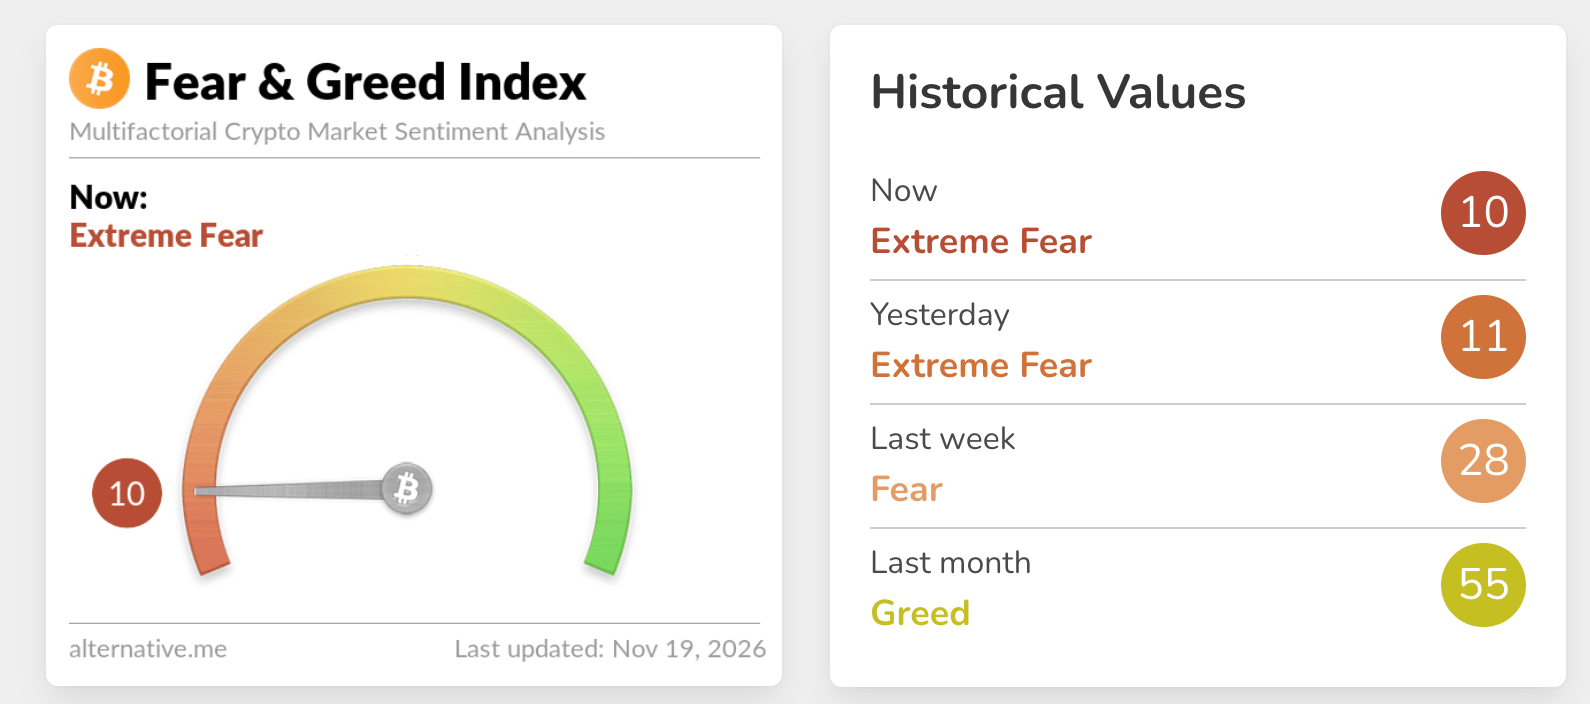
Risk appetite remains under pressure as the Fear & Greed Index registers 10 in Extreme Fear territory on Thursday. This marks only a marginal fall from the previous day’s reading of 11 in the same zone, but a steep retreat from 55 in the Greed zone last month.
Continued weakness in crypto market sentiment would keep the balance of risks firmly tilted to the downside. That would limit gains to $1.00 and increase the likelihood of a deeper correction below $0.90. However, traders should avoid becoming excessively bearish, since periods of extreme fear often coincide with a reversal in prices and a recovery.
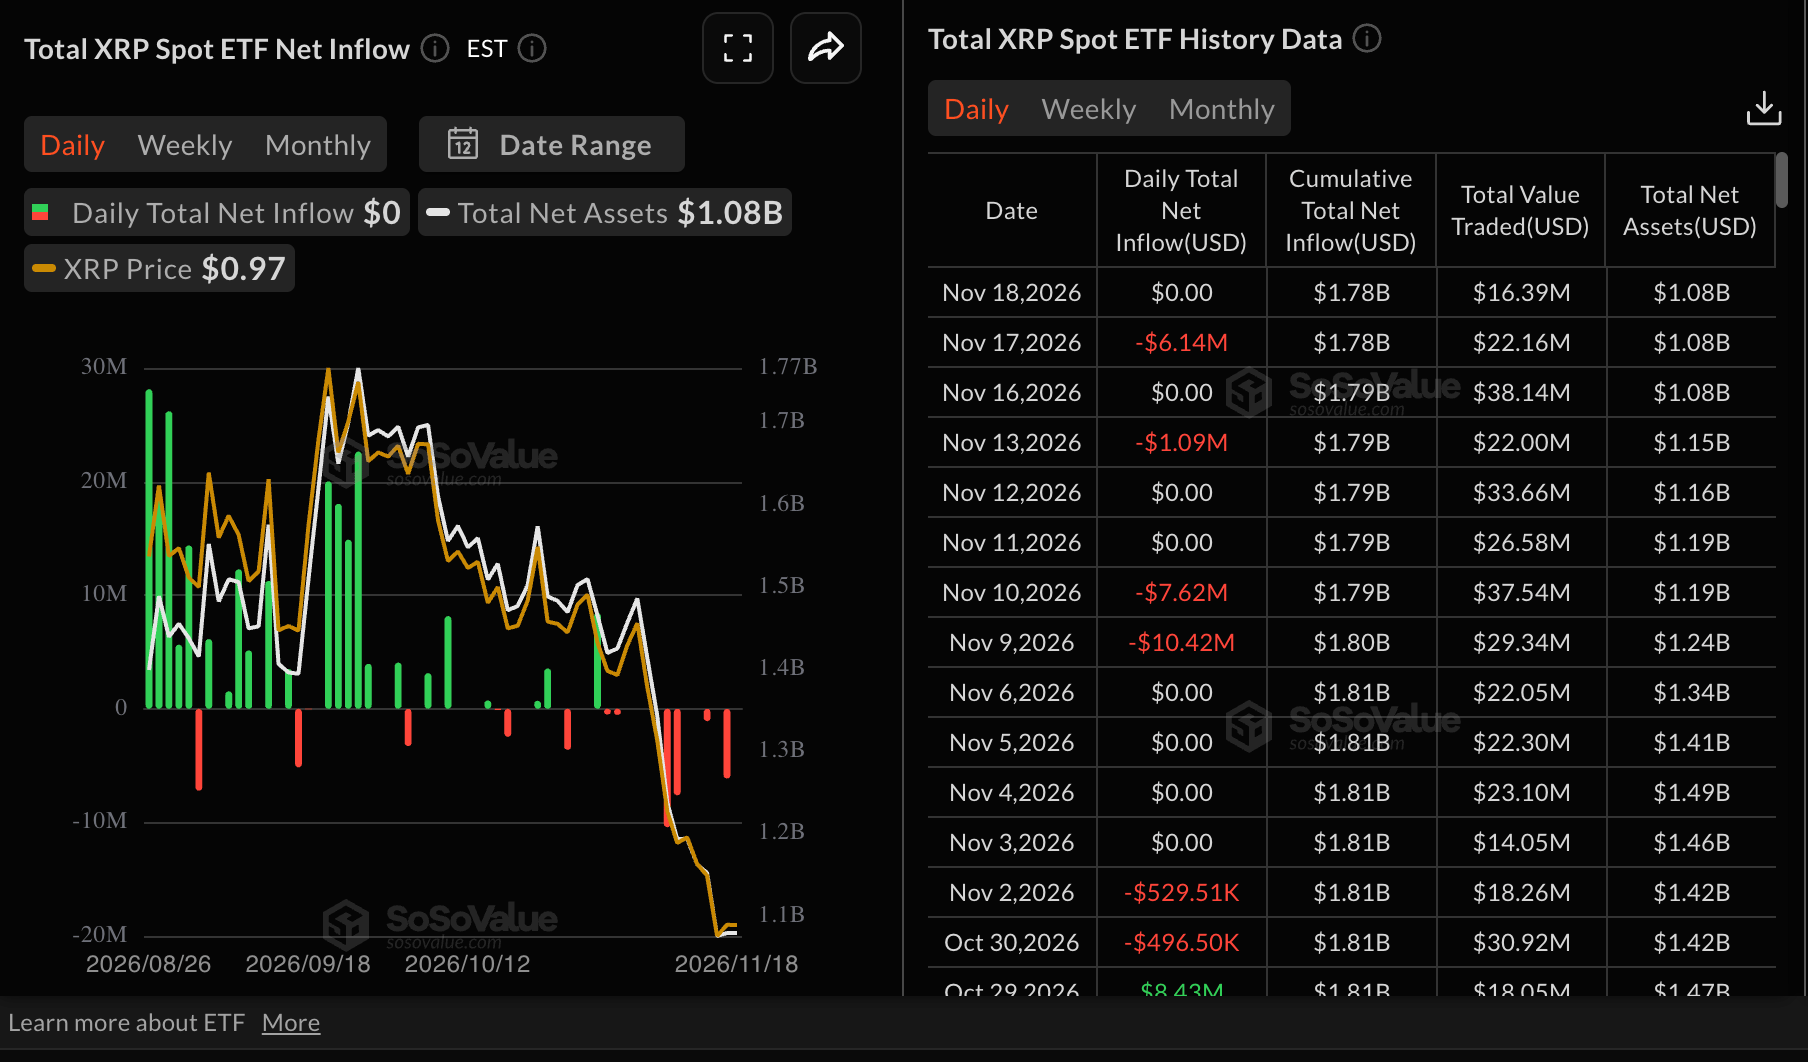
Wednesday, meanwhile, brought little activity, with flows at zero. The broader picture remains bearish following outflows of $6 million the previous day and $1 million last Friday. Although XRP spot ETFs mark their first anniversary this month, cumulative inflows average $1.8 billion and net assets under management stand at $1.1 billion. These figures point to undersubscription relative to Bitcoin (BTC) and Ethereum (ETH).
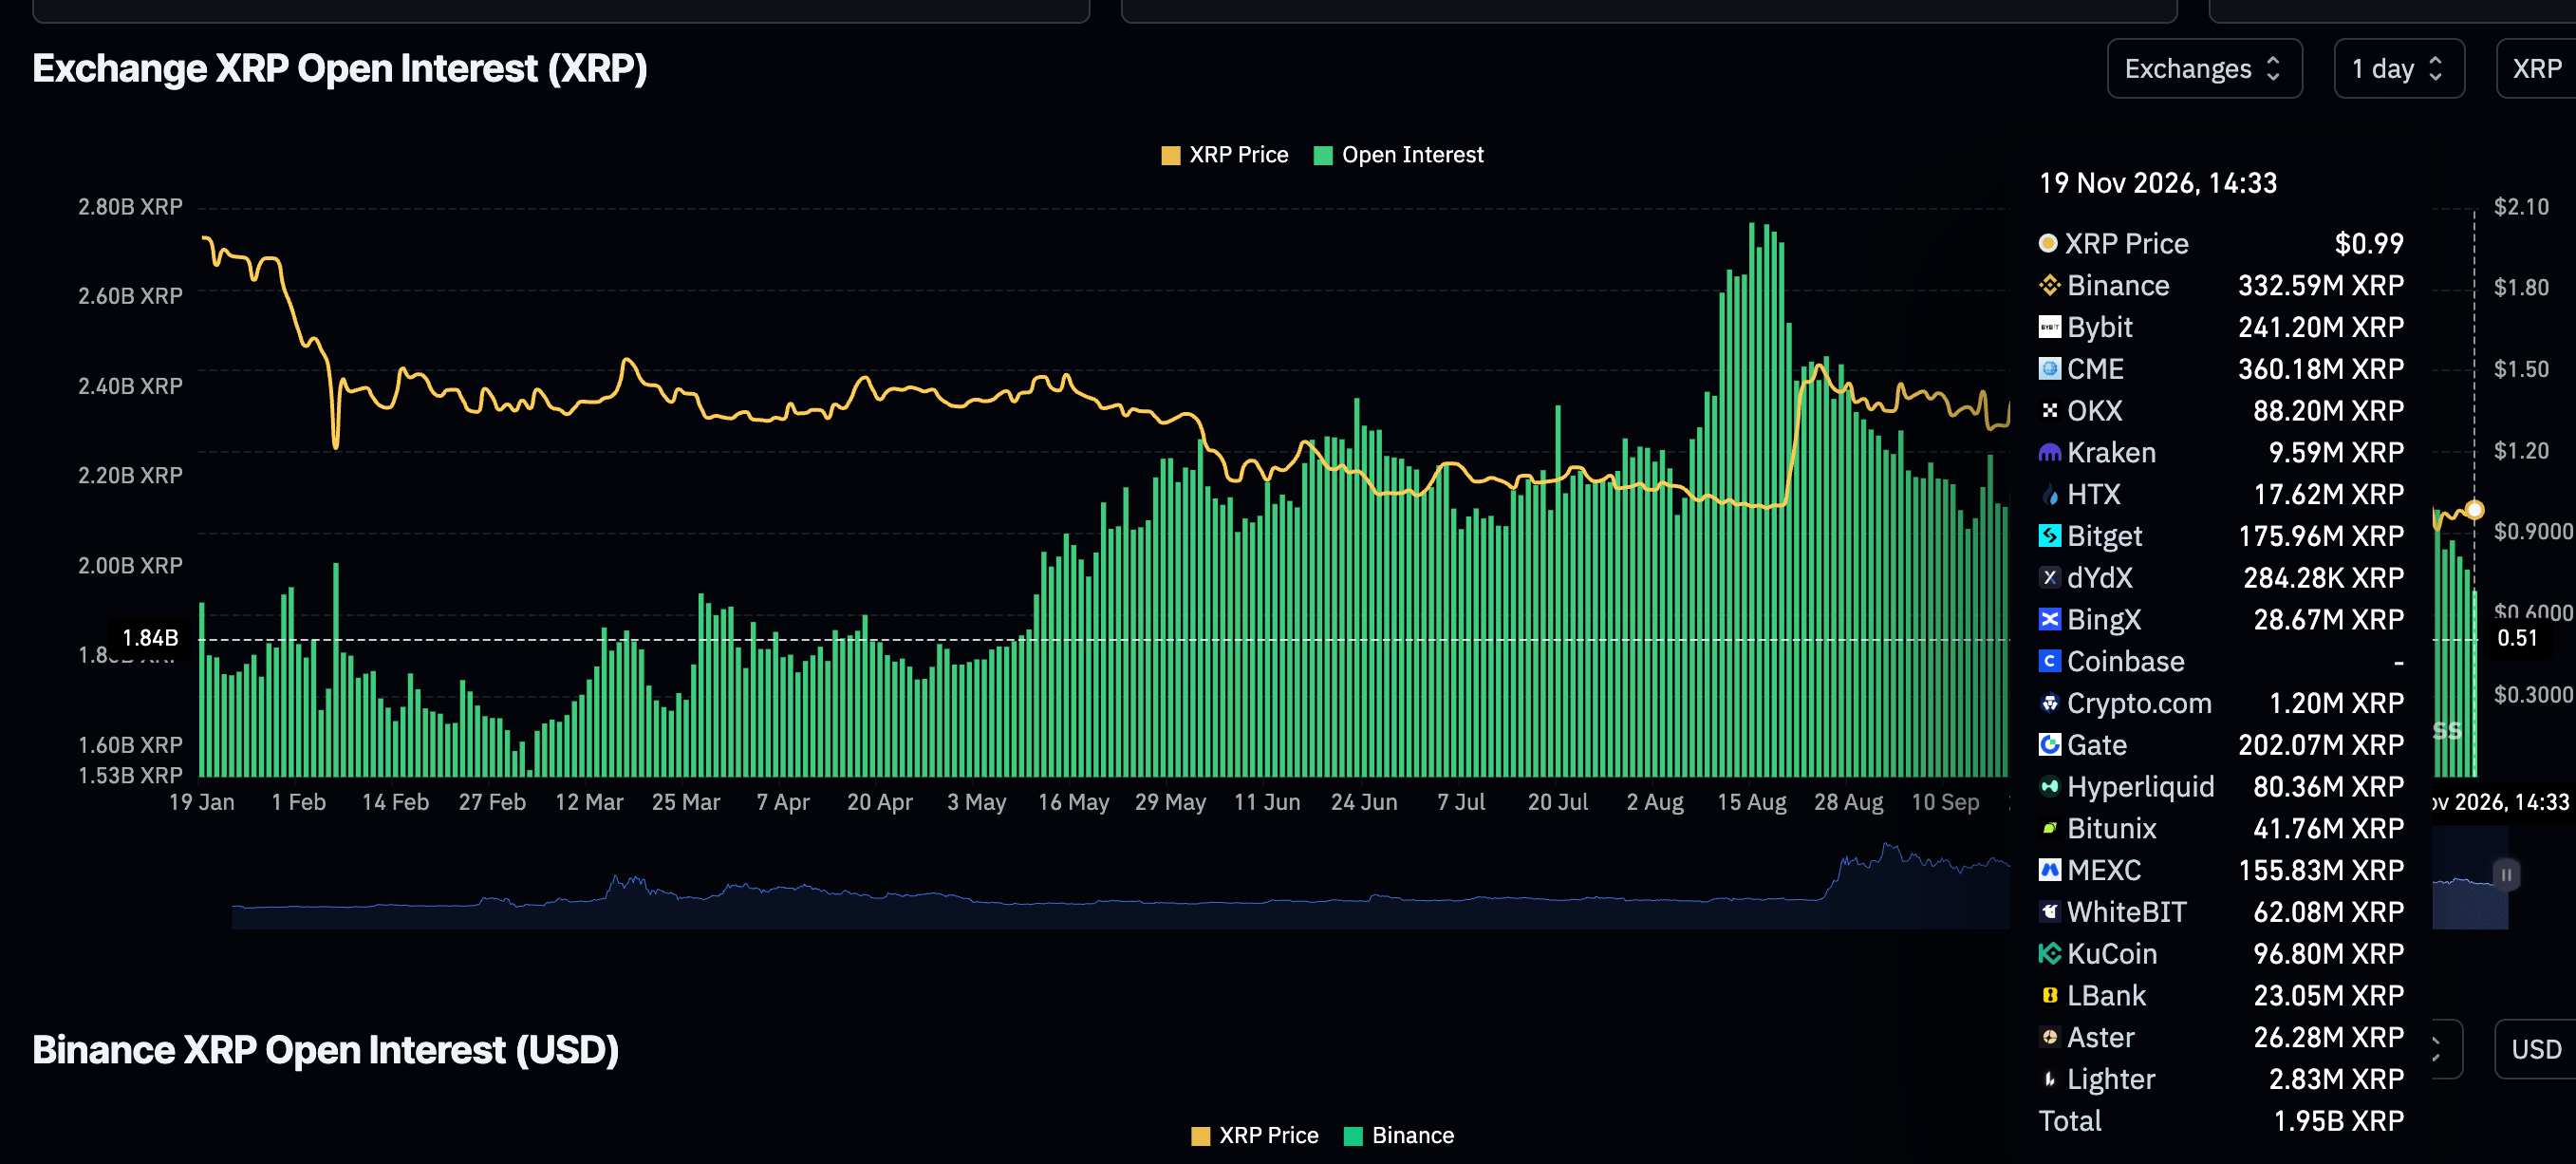
Weakness also persists in derivatives, where perpetual futures Open Interest (OI) averages 1.95 billion XRP on Thursday, compared with 2.02 billion XRP a day earlier. The wider pullback is evident in CoinGlass data, with OI down from 2.36 billion XRP on November 8 and 2.77 billion in mid-August. Muted retail demand indicates that traders may be actively cutting risk exposure or staying on the sidelines until stability returns before participating again. The resulting drag on demand directly reduces the scope for a recovery.
Technical analysis: Can XRP break out of sideways trading?
The near-term outlook for XRP remains firmly bearish as its decline extends well below key Exponential Moving Averages (EMAs), with the token trading near $0.98. Any rebound would encounter successive layers of supply at the 50-day Exponential Moving Average (EMA) of $1.20, the descending trendline resistance near $1.22 and the 100-day EMA of $1.25. These overhead barriers would need to be overcome before the broader downtrend could ease.
Momentum indicators add to the signs of pressure. The Relative Strength Index (RSI) is hovering around 32, while the Moving Average Convergence Divergence (MACD) indicator remains below zero. Together, they suggest that sellers are still in control even as oversold signals begin to emerge.
The pivotal $1.00 level presents the first resistance, with the 50-day EMA near $1.20 next in line. Beyond it lies the descending trendline at $1.22, where repeated failures have previously halted recovery attempts. Further overhead, the 100-day EMA at $1.25 and the more distant 200-day EMA at $1.33 form a wider supply zone. As long as prices remain beneath these levels, that zone would likely restrain any medium-term rebound.
Short-term traders may turn to intraday price movements and spikes in volume to identify emerging buying interest, as the daily chart highlights no clear structural support levels. Even so, the technical setup continues to favour selling into rallies below the clustered moving-average resistance zone.
(The technical analysis of this story was written with the help of an AI tool. Know more.)
FAQs on Open Interest and funding rates
An increase in Open Interest is linked to greater liquidity and fresh capital entering the market. It is viewed as an improvement in efficiency that supports continuation of the prevailing trend. Conversely, falling Open Interest is regarded as evidence of market liquidation: investors are exiting and overall demand for an asset is weakening, reinforcing bearish sentiment.
By raising the liquidation risks traders face, funding fees narrow the gap between an asset’s spot price and its futures contract prices. Persistently high, positive funding rates signal bullish sentiment among market participants and expectations of a price increase. In contrast, a persistently negative funding rate signals bearish sentiment towards an asset. It indicates that traders anticipate a fall in the cryptocurrency’s price and that a bearish trend reversal is likely.
POPULAR ARTICLES
1The Euro faces a week dominated by US inflation with a rate hike already priced in2Why is the British Pound under pressure from softer inflation and slower pay growth ahead of PMI week?3Dow Jones Industrial Average extends losses to a fifth day amid broader AI sell-off4Chinese Yuan: Controls Triggered by Short-Lived Fall Against US Dollar - Commerzbank5Malaysian Ringgit: How are chip export curbs and yields weighing on MYR against US Dollar? – OCBC6Chinese Yuan: Gradual gains amid tight management – BNY7Why does the Australian Dollar remain under pressure amid diverging Fed and RBA outlooks?8Malaysian Ringgit: Why does range-bound trading persist as growth outpaces FX? – Commerzbank9Indonesian Rupiah: Losses against US Dollar limited by BI measures - OCBC

Get Started!
Sign up and access the Global Markets in less than 3 minutes

Connect With Us









Contacts
Phone: +61 2 8036 8388
Fax: +61 2 8036 8388
Email: support@tmgm.com



The information provided on this website is of a general nature only and does not constitute personal financial advice. Before acting on any information on this website, you should consider the suitability of the information in relation to your objectives, financial situation and needs. Investing in CFDs and FX Margin Contracts carries significant risks and is not suitable for all investors. You may lose more than your initial deposit. You do not own, or have, any interest in the underlying asset. We recommend that you seek independent advice and ensure you fully understand the risks involved before trading. It is important that you read and consider the disclosure document before you acquire any product listed on the website. The information and advertisements offered on this website are not intended for use by any person in any country or jurisdiction where such use would be contrary to local laws and regulations. The Products and Services offered on this website are not intended for residents of the United States, Malaysia and Thailand.
TMGM is authorized and regulated in various jurisdictions.
Trademax Australia Limited, trading as TMGM, is regulated by the Australian Securities and Investments Commission (ASIC), AFSL no. 436416 and is located at Level 28, One International Tower, 100 Barangaroo Avenue, 2000 Sydney, NSW Australia.
Email: support@tmgm.com.au
Trademax Global Limited, trading as TMGM, is authorized and regulated by the Vanuatu Financial Services Commission (VFSC), registration number 40356 and registered at 1276, Kumul Highway, Port Vila, Vanuatu, Republic of Vanuatu.
Email: support@tmgm.com
Trademax Global Markets (SE) Limited, trading as TMGM, is authorized and regulated by the Financial Services Authority (FSA) of Seychelles, with license number SD224. The company is registered at Office No 13, Providence Estate ABIS Centre, Mahe, Seychelles.
Email: support@tmgm.com
Trademax Global Markets (International) Pty Ltd, trading as TMGM, is authorized and regulated by the Financial Services Commission, Mauritius (FSC) with license no. GB22201012, and registered at 33, Edith Cavell Street C/o IQ EQ Fund Services (Mauritius) Ltd Port Louis, 11324 Mauritius.
Email: support@tmgm.com
Copyright © TMGM. All rights reserved