
News & AnalysisCareer

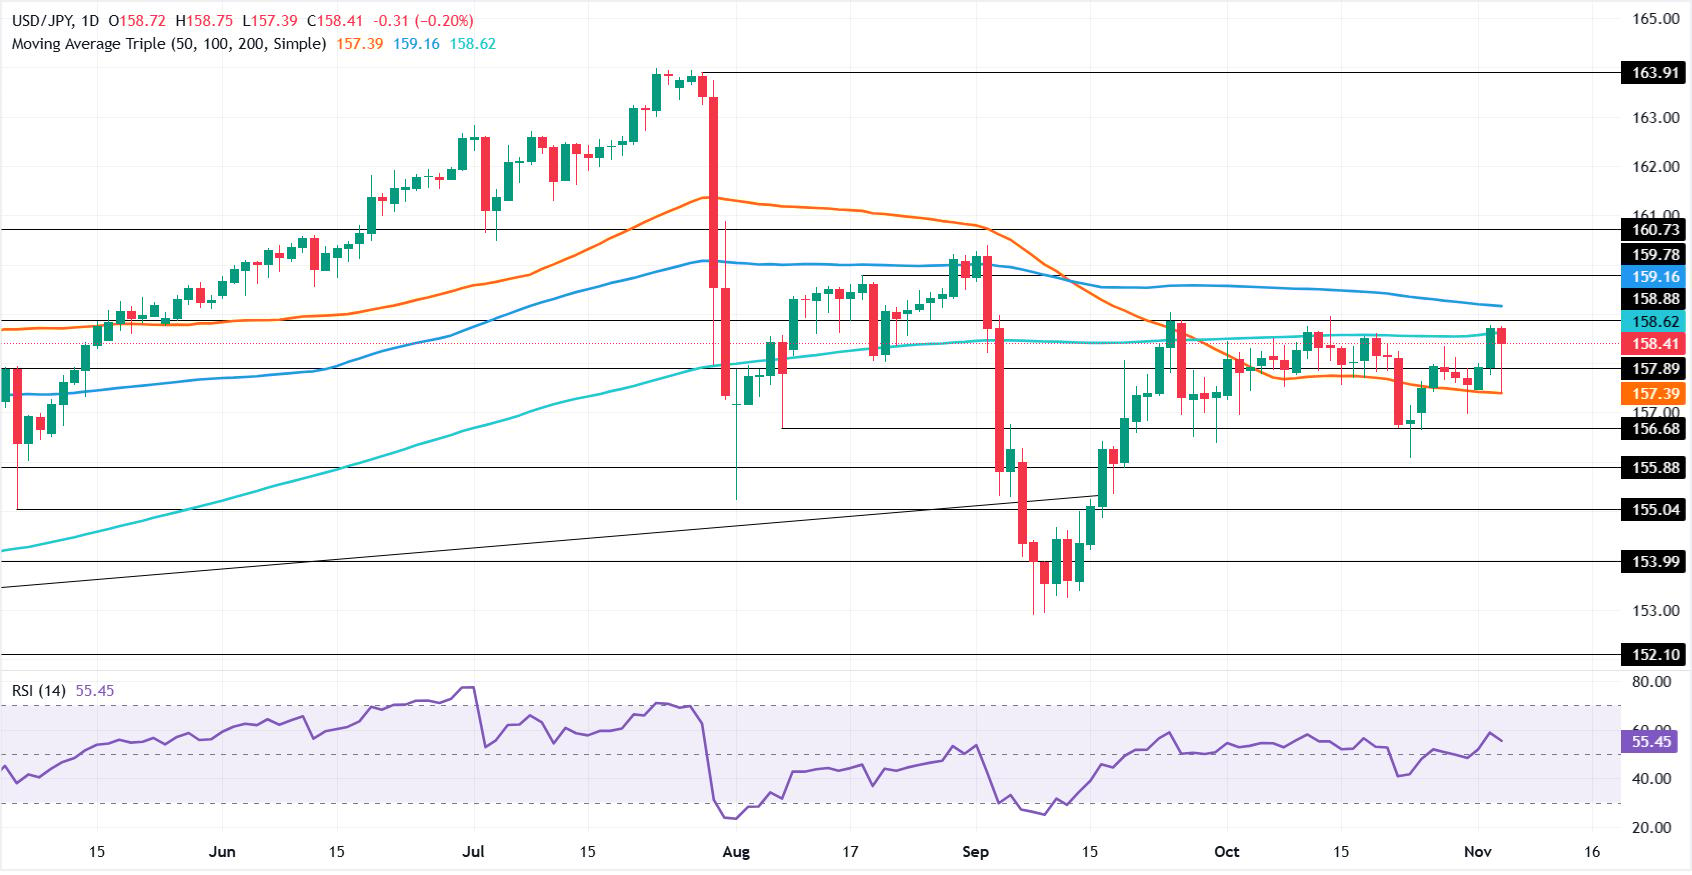
Down 0.20% following the US midterm election results, USD/JPY has recovered some of its earlier losses but remains slightly lower. A tilted bullish pin bar appears to be taking shape, although the pair continues to consolidate between the 50- and 200-day SMAs at 157.39 and 158.62, respectively. It is trading at 158.41 at the time of writing.

With no clear directional bias, USD/JPY continues to trade quietly. Lower highs and lower lows still define the market structure. A recovery above 159.00, however, would open the way towards the 100-day SMA at 159.16, with buyers looking for a test of 160.00.
Momentum suggests such a move remains a distant prospect: despite holding in bullish territory, the Relative Strength Index (RSI) is turning lower. Nevertheless, a rise through 160.00 could allow buyers to overturn the bearish market structure by breaking above the 2 September high of 160.39.
For the decline to resume, sellers would first need to push USD/JPY beneath 158.00, then break through the 50-day SMA at 157.39. Below that average, 157.00 would come into view, followed by the 23 October low of the day (LOD) at 156.08.
Today's percentage movements in the Japanese Yen (JPY) against the major currencies listed are set out below. The US Dollar was the currency against which the Japanese Yen performed best.
| USD | EUR | GBP | JPY | CAD | AUD | NZD | CHF | |
|---|---|---|---|---|---|---|---|---|
| USD | -0.37% | -0.44% | -0.21% | -0.27% | -0.54% | -0.22% | -0.52% | |
| EUR | 0.37% | -0.06% | 0.20% | 0.13% | -0.16% | 0.20% | -0.15% | |
| GBP | 0.44% | 0.06% | 0.23% | 0.17% | -0.10% | 0.23% | -0.09% | |
| JPY | 0.21% | -0.20% | -0.23% | -0.07% | -0.34% | -0.03% | -0.33% | |
| CAD | 0.27% | -0.13% | -0.17% | 0.07% | -0.27% | 0.04% | -0.26% | |
| AUD | 0.54% | 0.16% | 0.10% | 0.34% | 0.27% | 0.32% | 0.02% | |
| NZD | 0.22% | -0.20% | -0.23% | 0.03% | -0.04% | -0.32% | -0.29% | |
| CHF | 0.52% | 0.15% | 0.09% | 0.33% | 0.26% | -0.02% | 0.29% |
Percentage movements between the major currencies are displayed in the heat map. Select the base currency from the left-hand column and the quote currency from the top row. Selecting the Japanese Yen on the left and following its row across to the US Dollar, for instance, gives the percentage change for JPY (base)/USD (quote) in the corresponding cell.







Phone: +61 2 8036 8388
Fax: +61 2 8036 8388
Email: support@tmgm.com



The information provided on this website is of a general nature only and does not constitute personal financial advice. Before acting on any information on this website, you should consider the suitability of the information in relation to your objectives, financial situation and needs. Investing in CFDs and FX Margin Contracts carries significant risks and is not suitable for all investors. You may lose more than your initial deposit. You do not own, or have, any interest in the underlying asset. We recommend that you seek independent advice and ensure you fully understand the risks involved before trading. It is important that you read and consider the disclosure document before you acquire any product listed on the website. The information and advertisements offered on this website are not intended for use by any person in any country or jurisdiction where such use would be contrary to local laws and regulations. The Products and Services offered on this website are not intended for residents of the United States, Malaysia and Thailand.
TMGM is authorized and regulated in various jurisdictions.
Trademax Australia Limited, trading as TMGM, is regulated by the Australian Securities and Investments Commission (ASIC), AFSL no. 436416 and is located at Level 28, One International Tower, 100 Barangaroo Avenue, 2000 Sydney, NSW Australia.
Email: support@tmgm.com.au
Trademax Global Limited, trading as TMGM, is authorized and regulated by the Vanuatu Financial Services Commission (VFSC), registration number 40356 and registered at 1276, Kumul Highway, Port Vila, Vanuatu, Republic of Vanuatu.
Email: support@tmgm.com
Trademax Global Markets (SE) Limited, trading as TMGM, is authorized and regulated by the Financial Services Authority (FSA) of Seychelles, with license number SD224. The company is registered at Office No 13, Providence Estate ABIS Centre, Mahe, Seychelles.
Email: support@tmgm.com
Trademax Global Markets (International) Pty Ltd, trading as TMGM, is authorized and regulated by the Financial Services Commission, Mauritius (FSC) with license no. GB22201012, and registered at 33, Edith Cavell Street C/o IQ EQ Fund Services (Mauritius) Ltd Port Louis, 11324 Mauritius.
Email: support@tmgm.com
Copyright © TMGM. All rights reserved


