
News & AnalysisCareer

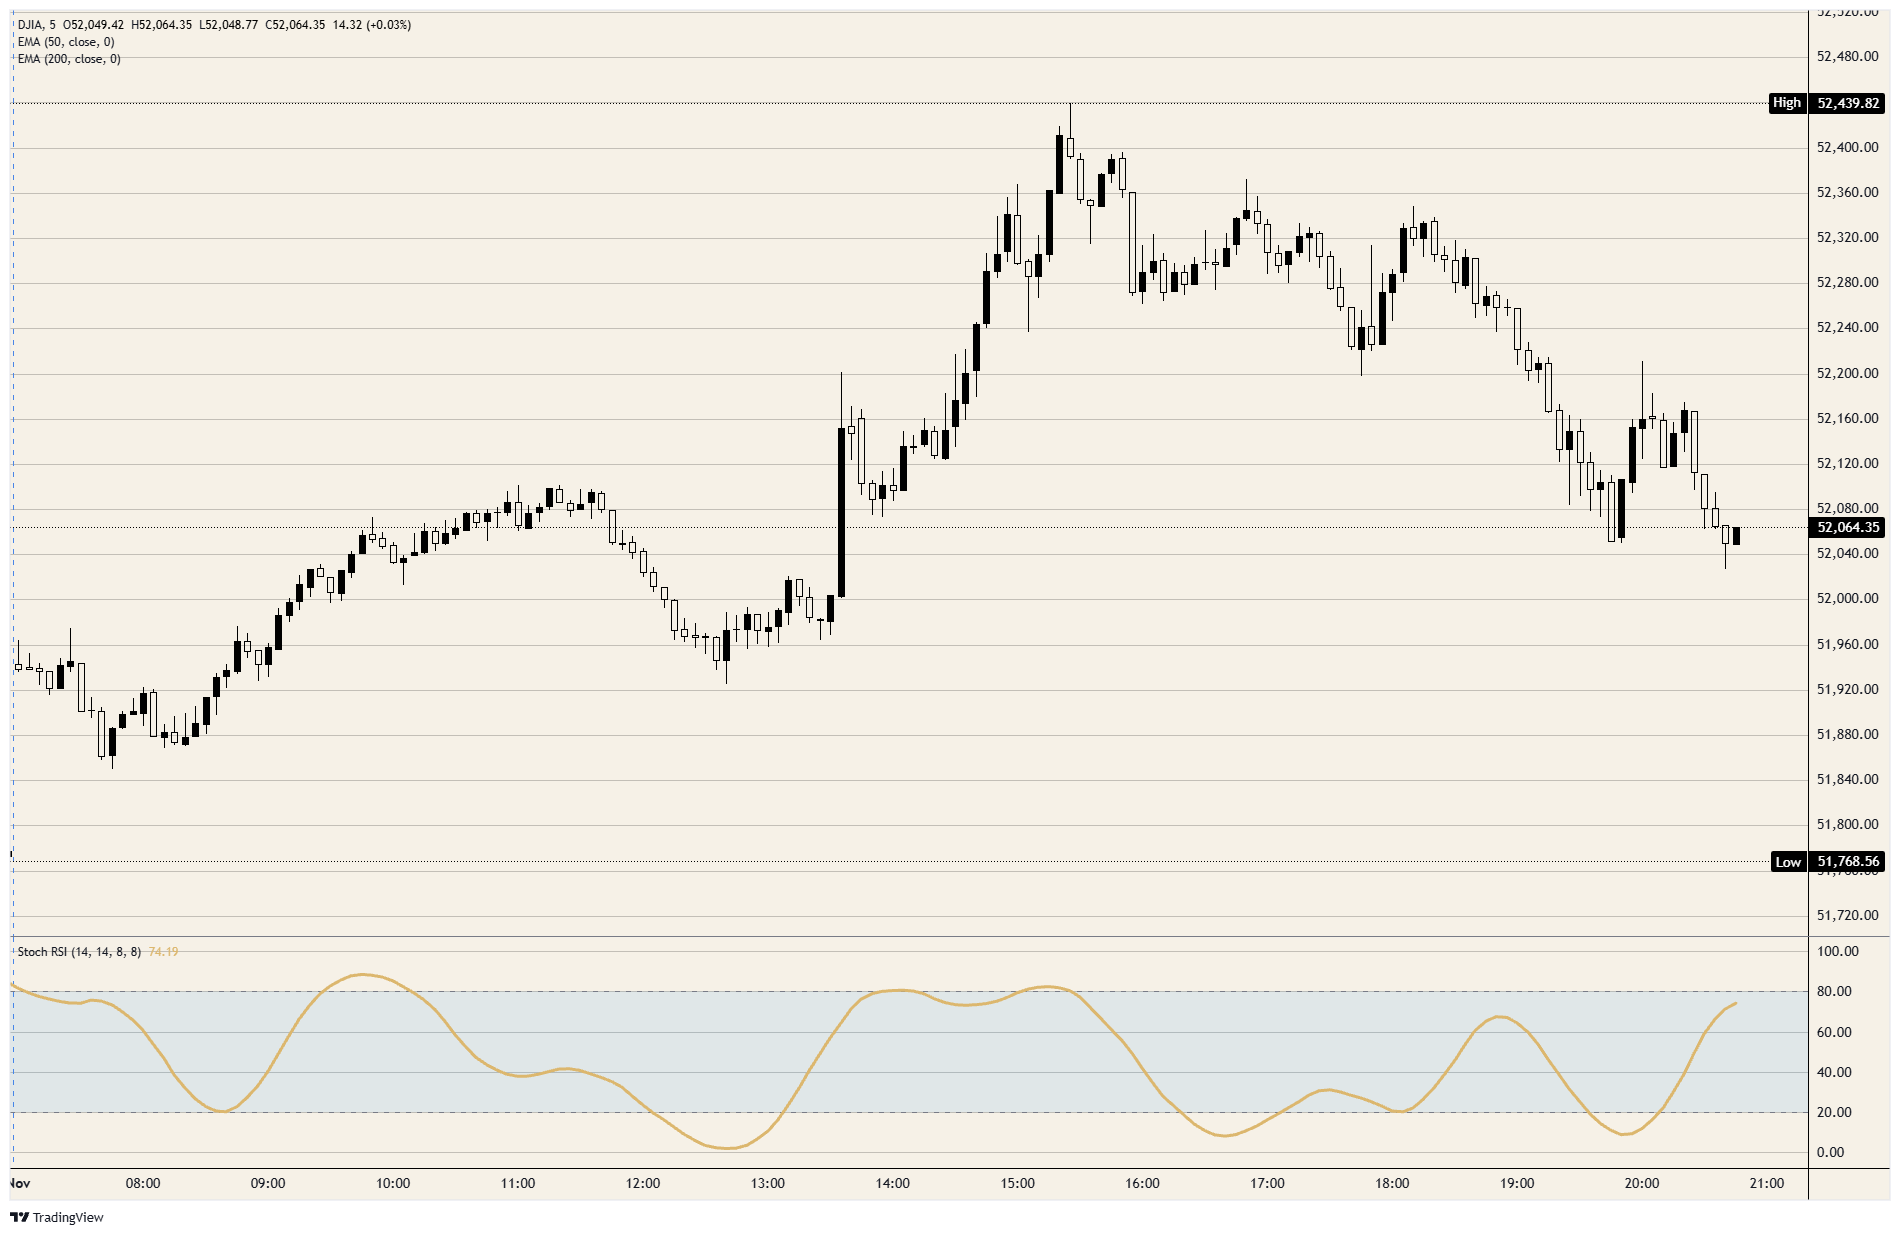
Oracle (ORCL)'s filing to raise $20 billion for artificial intelligence (AI) prompted investors to sell technology shares and buy the industrial and retail stocks that populate the Dow Jones Industrial Average. Having advanced from just above 51,800 to just below 52,500, the index has since surrendered about two-thirds of that rise and is trading just above 52,000. Trading throughout the session has remained within Friday's range.

Construction spending recorded its steepest monthly fall since April 2020, largely owing to housing, yet Sherwin-Williams (SHW) gained 5.6% and Home Depot (HD) added 3.3% on the day. Funding and deal developments sent Oracle, Marvell (MRVL) and Lumentum (LITE) down 6%-18%; none belongs to the Dow. Losses among the index's technology constituents were smaller: Nvidia (NVDA) slipped about 0.5%, while Apple (AAPL) shed 2% ahead of its results.
President Trump's statement that he was in no hurry to resume the war with Iran sent Crude Oil more than 7% lower. At 55.5, the Institute for Supply Management (ISM) factory index exceeded the 54.6 forecast, while its prices index declined to 75.2. Against a backdrop of growing orders and lower fuel costs, Dow manufacturers Honeywell (HON), 3M (MMM) and Boeing (BA) all gained more than 2%.
Tuesday brings September job openings at 15:00 GMT, followed on Wednesday at 15:00 GMT by the ISM services index, which is forecast at 54.8 versus 54.9 previously. Friday's October nonfarm payrolls report, due at 13:30 GMT, is forecast to show 65K after 29K, while unemployment is expected to remain at 4.2%. All these releases have implications for demand for the industrial and retail companies driving the Dow's advance.
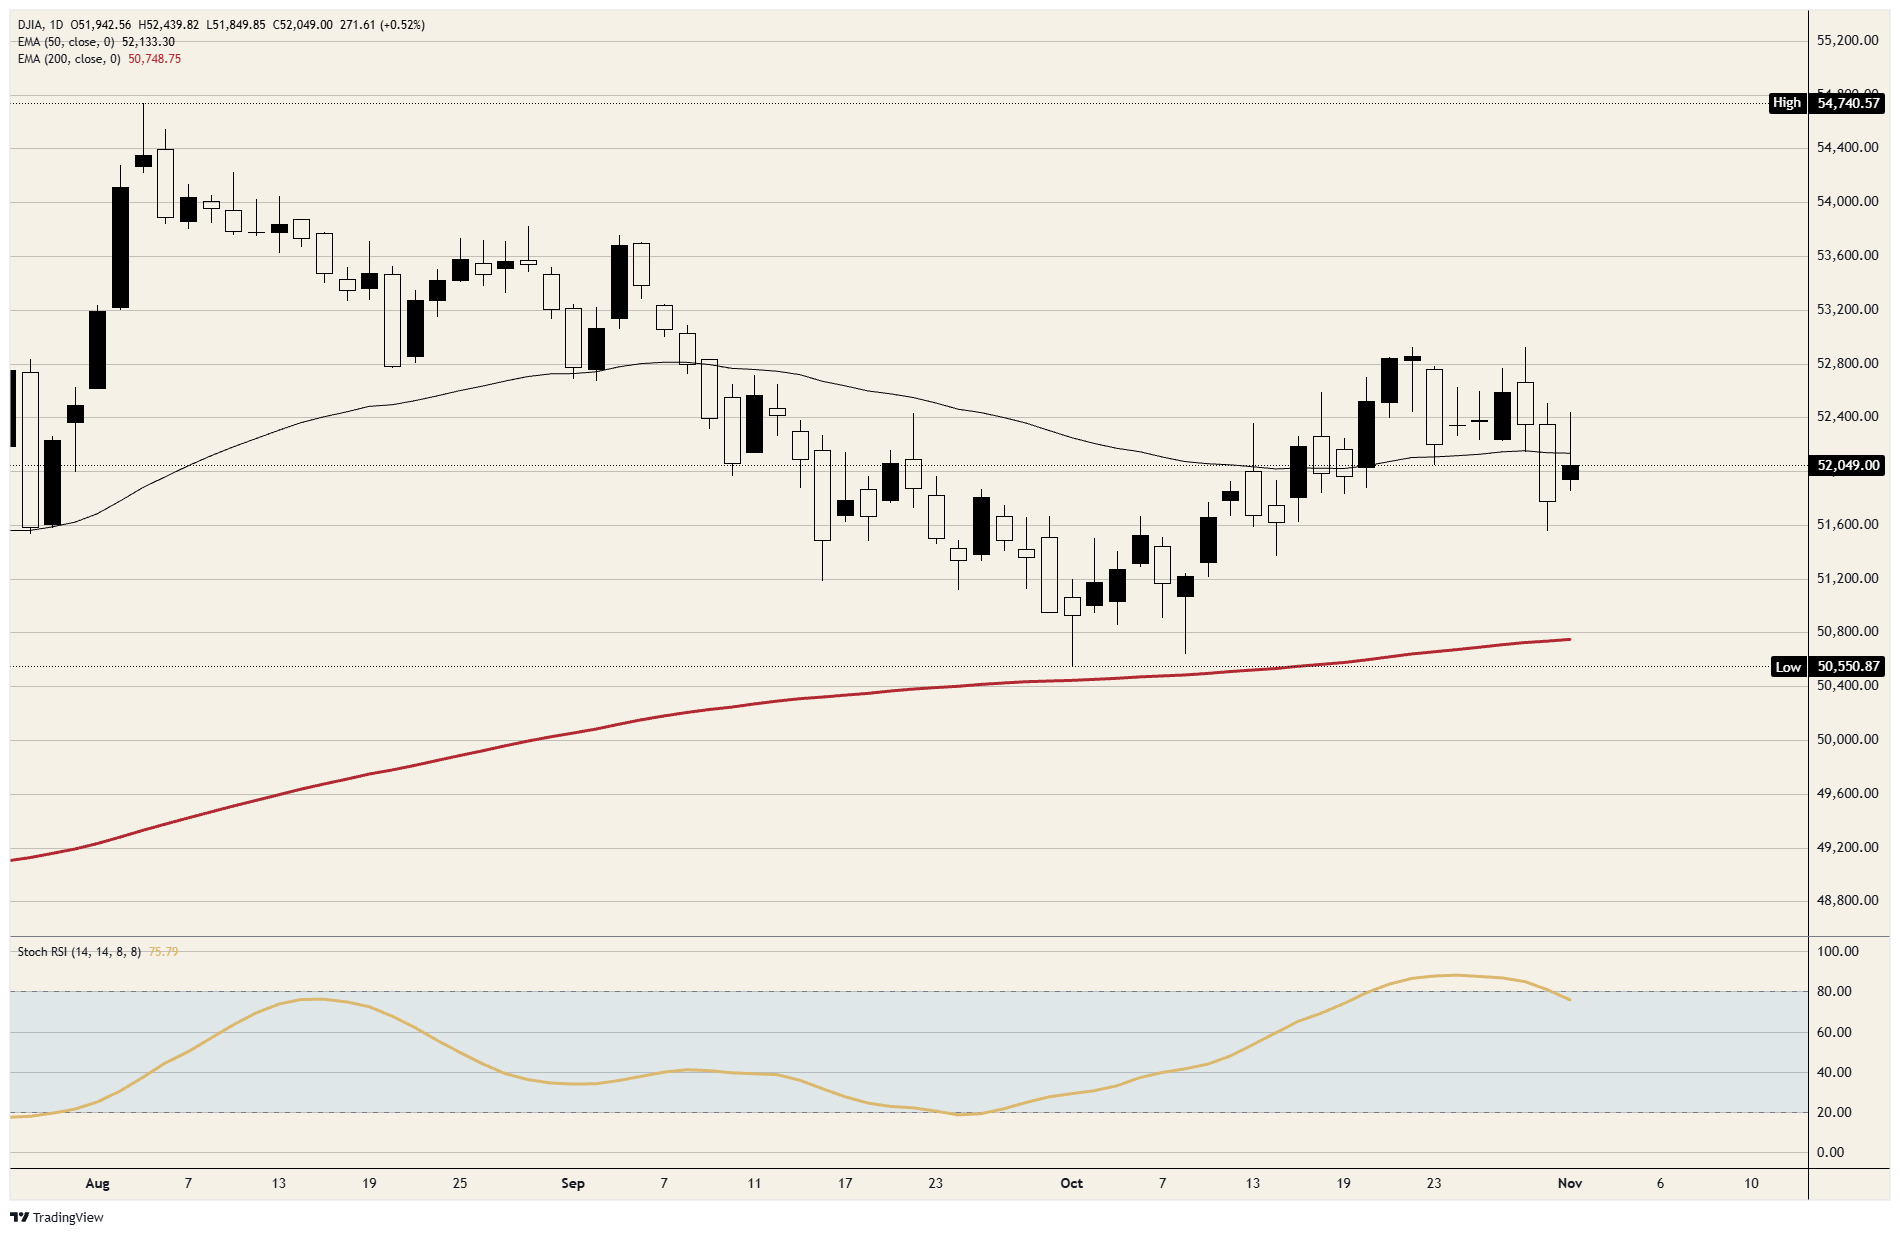
More than a third of the advance from the 1 October low just above 50,500 to the late-October high near 52,900 has now been retraced. The index sits slightly below its 50-day Exponential Moving Average (EMA), near 52,100, but remains comfortably above its 200-day EMA near 50,750. After spending two weeks in overbought territory, daily momentum has moved out of that zone.
Comprising the 30 most traded US stocks, the Dow Jones Industrial Average ranks among the world's oldest stock market indices. Weightings are based on share prices, not market capitalisation: the prices of its constituent shares are added together and divided by a factor, currently 0.152. Its founder, Charles Dow, also established the Wall Street Journal. In subsequent years, critics have questioned how broadly representative it is, given that it follows only 30 conglomerates rather than the wider range covered by indices such as the S&P 500.
The combined performance of its constituent companies, as reported in their quarterly earnings, is the principal influence on the Dow Jones Industrial Average (DJIA). Other drivers include US and global macroeconomic releases, which shape investor sentiment. Interest rates set by the Federal Reserve (Fed) also matter, since they determine the cost of credit on which many businesses depend heavily. Inflation and other indicators that inform Fed decisions can therefore exert a significant influence on the index.
Developed by Charles Dow, Dow Theory seeks to identify the stock market's primary trend. It involves comparing the direction of the Dow Jones Industrial Average (DJIA) with that of the Dow Jones Transportation Average (DJTA), following a trend only when both move in the same direction. Trading volume provides confirmation, and the approach incorporates analysis of peaks and troughs. Dow's theory describes three phases in a trend: accumulation, as smart money begins buying or selling; public participation, as the wider public enters; and distribution, as smart money withdraws.
Investors can trade the DJIA through several instruments. ETFs offer exposure through a single security, removing the need to purchase shares in each of the 30 constituent companies individually; the SPDR Dow Jones Industrial Average ETF (DIA) is a prominent example. Traders can also speculate on the index's future value using DJIA futures contracts. Options, meanwhile, grant the right, without an obligation, to buy or sell the index at a predetermined price in the future. By purchasing a share in a diversified portfolio of DJIA stocks through mutual funds, investors can gain exposure to the index as a whole.







Phone: +61 2 8036 8388
Fax: +61 2 8036 8388
Email: support@tmgm.com



The information provided on this website is of a general nature only and does not constitute personal financial advice. Before acting on any information on this website, you should consider the suitability of the information in relation to your objectives, financial situation and needs. Investing in CFDs and FX Margin Contracts carries significant risks and is not suitable for all investors. You may lose more than your initial deposit. You do not own, or have, any interest in the underlying asset. We recommend that you seek independent advice and ensure you fully understand the risks involved before trading. It is important that you read and consider the disclosure document before you acquire any product listed on the website. The information and advertisements offered on this website are not intended for use by any person in any country or jurisdiction where such use would be contrary to local laws and regulations. The Products and Services offered on this website are not intended for residents of the United States, Malaysia and Thailand.
TMGM is authorized and regulated in various jurisdictions.
Trademax Australia Limited, trading as TMGM, is regulated by the Australian Securities and Investments Commission (ASIC), AFSL no. 436416 and is located at Level 28, One International Tower, 100 Barangaroo Avenue, 2000 Sydney, NSW Australia.
Email: support@tmgm.com.au
Trademax Global Limited, trading as TMGM, is authorized and regulated by the Vanuatu Financial Services Commission (VFSC), registration number 40356 and registered at 1276, Kumul Highway, Port Vila, Vanuatu, Republic of Vanuatu.
Email: support@tmgm.com
Trademax Global Markets (SE) Limited, trading as TMGM, is authorized and regulated by the Financial Services Authority (FSA) of Seychelles, with license number SD224. The company is registered at Office No 13, Providence Estate ABIS Centre, Mahe, Seychelles.
Email: support@tmgm.com
Trademax Global Markets (International) Pty Ltd, trading as TMGM, is authorized and regulated by the Financial Services Commission, Mauritius (FSC) with license no. GB22201012, and registered at 33, Edith Cavell Street C/o IQ EQ Fund Services (Mauritius) Ltd Port Louis, 11324 Mauritius.
Email: support@tmgm.com
Copyright © TMGM. All rights reserved


