On Balance Volume Summarises Volume Trends
• OBV combines trading volume into a single trend line. Whether the closing price has risen or fallen determines whether on balance volume adds or deducts the period's volume. Traders can therefore follow one cumulative figure rather than individual volume bars.
• Direction alone drives the formula, not the scale of the move. The size of a price change has no weighting in OBV. The calculation simply compares the latest close with the previous one to establish whether it is higher, lower or unchanged.
• Divergence between OBV and price can indicate a weakening trend. A trend may be losing the volume support needed to sustain it when price heads one way and OBV heads the other.
• OBV serves primarily to confirm trends, rather than forecast them. Price and volume data must already be available before OBV responds, making it a lagging indicator. Most traders consequently use it alongside other tools, rather than in isolation.
• An isolated OBV reading has little significance. To interpret an upward or downward OBV line usefully, traders need to consider price, the reliability of the underlying volume data and the market concerned.
On Balance Volume (OBV) Tracks Cumulative Volume
By adding volume during rising periods and deducting it during falling periods, on balance volume maintains a cumulative total. This volume indicator therefore captures direction rather than representing any price level.
In his 1963 book, Granville's New Key to Stock Market Profits, Joseph Granville introduced OBV and argued that volume tends to lead price. Today, traders continue to use the indicator to assess whether trading volume reinforces a price move or runs counter to it.
OBV Measures the Volume Pressure Behind Price
Rather than measuring price itself, on balance volume captures the net buying and selling pressure implied by volume. A higher close adds the period's volume to the cumulative total; a lower close deducts it. The resulting line represents the pressure developing behind price movements.
Actual buy and sell orders are not displayed directly by OBV. Traders regard its calculation, which combines closing-price direction with volume, as a reasonable proxy for that pressure, rather than a live count of orders. Later sections explain how to interpret this pressure alongside price.
Four Inputs Determine the OBV Calculation
Calculating OBV requires the latest closing price, the preceding closing price, the current period's volume and the previous OBV reading. The comparison between the closing prices determines whether the new volume is added to the cumulative total, deducted from it or excluded.
The On Balance Volume Formula Applies Three Rules
Three possible outcomes govern the OBV formula, depending on how the latest closing price compares with the previous day's closing price, as set out below.
Closing-Price Condition | Resulting OBV Calculation |
The latest closing price exceeds the preceding close | Add the current period's volume to the previous OBV to obtain the new reading, thereby increasing the cumulative volume |
The latest closing price is below the preceding close | Deduct the current period's volume from the previous OBV to obtain the new reading, thereby reducing the cumulative volume |
The latest closing price matches the preceding close | The new OBV reading remains equal to its preceding value |
A starting value is needed before OBV can be calculated. Charting platforms generally initialise it at zero or at the volume recorded in that period, applying the three rules from the following period onwards. Since OBV is cumulative, its numerical value may be positive or negative according to the starting point. The useful information lies only in the subsequent direction and shape of the line. Hypothetical prices and volumes in the following table illustrate the calculation; they are not actual market data.
An OBV Example Demonstrates the Calculation
Trading Period | Price at Close | Period Volume | Closing Direction | OBV Reading |
1 | $50.00 | 1,200 | Initial period | 1,200 |
2 | $50.50 | 1,500 | Higher close | 2,700 |
3 | $50.20 | 900 | Lower close | 1,800 |
4 | $50.20 | 1,100 | Unchanged close | 1,800 |
5 | $51.00 | 2,000 | Higher close | 3,800 |
The deduction in period 3 illustrates the subtraction rule. In period 4, the unchanged closing price leaves OBV unchanged too, despite trading volume being recorded. One simplified way to understand OBV is to multiply the number of up days minus down days by average volume. Small price movements still contribute: days when price changed by less than 0.25% accounted for 14.5% of changes in OBV.
Reading On Balance Volume Requires a Price Comparison
To interpret OBV, compare its direction and swing points with those on the accompanying price chart, rather than focusing on its numerical reading. This comparison also reveals on balance volume divergence, which occurs when OBV and price no longer move together.
Where the calculation begins determines the absolute OBV reading, leaving that number meaningless in isolation. Instead, the relevant questions are whether the line is climbing or declining and whether its swing points are higher or lower relative to price. The following sections examine these relationships.
Rising and Falling OBV Indicate Changes in Volume Pressure
When volume accumulates on up days faster than it is deducted on down days, the OBV line rises. Traders interpret this as increasing buying pressure beneath the price. If volume grows alongside price, that rise can indicate upward momentum. A declining line conveys the reverse: deductions during down periods exceed additions during up periods, pointing to selling pressure and potentially warning of diminishing volume support.
A broadly balanced distribution of volume between rising and falling periods produces a flat or sideways OBV line, with neither side clearly dominant. These patterns offer no guarantee about the next price move. The direction of OBV provides context, not an independent instruction to trade.
OBV Confirms Trends by Moving Alongside Price
For OBV to confirm a price trend, both must move in the same direction over the same period. A higher high in price accompanied by a higher high in OBV indicates stronger volume support for the trend. By contrast, if price advances without OBV reaching a fresh high, the rise lacks full volume backing. That is a warning, rather than an exit signal.
A correlation of 0.959 between OBV and price movement has been reported in some research. This helps explain why traders primarily employ it for trend confirmation, rather than as a signal in its own right.
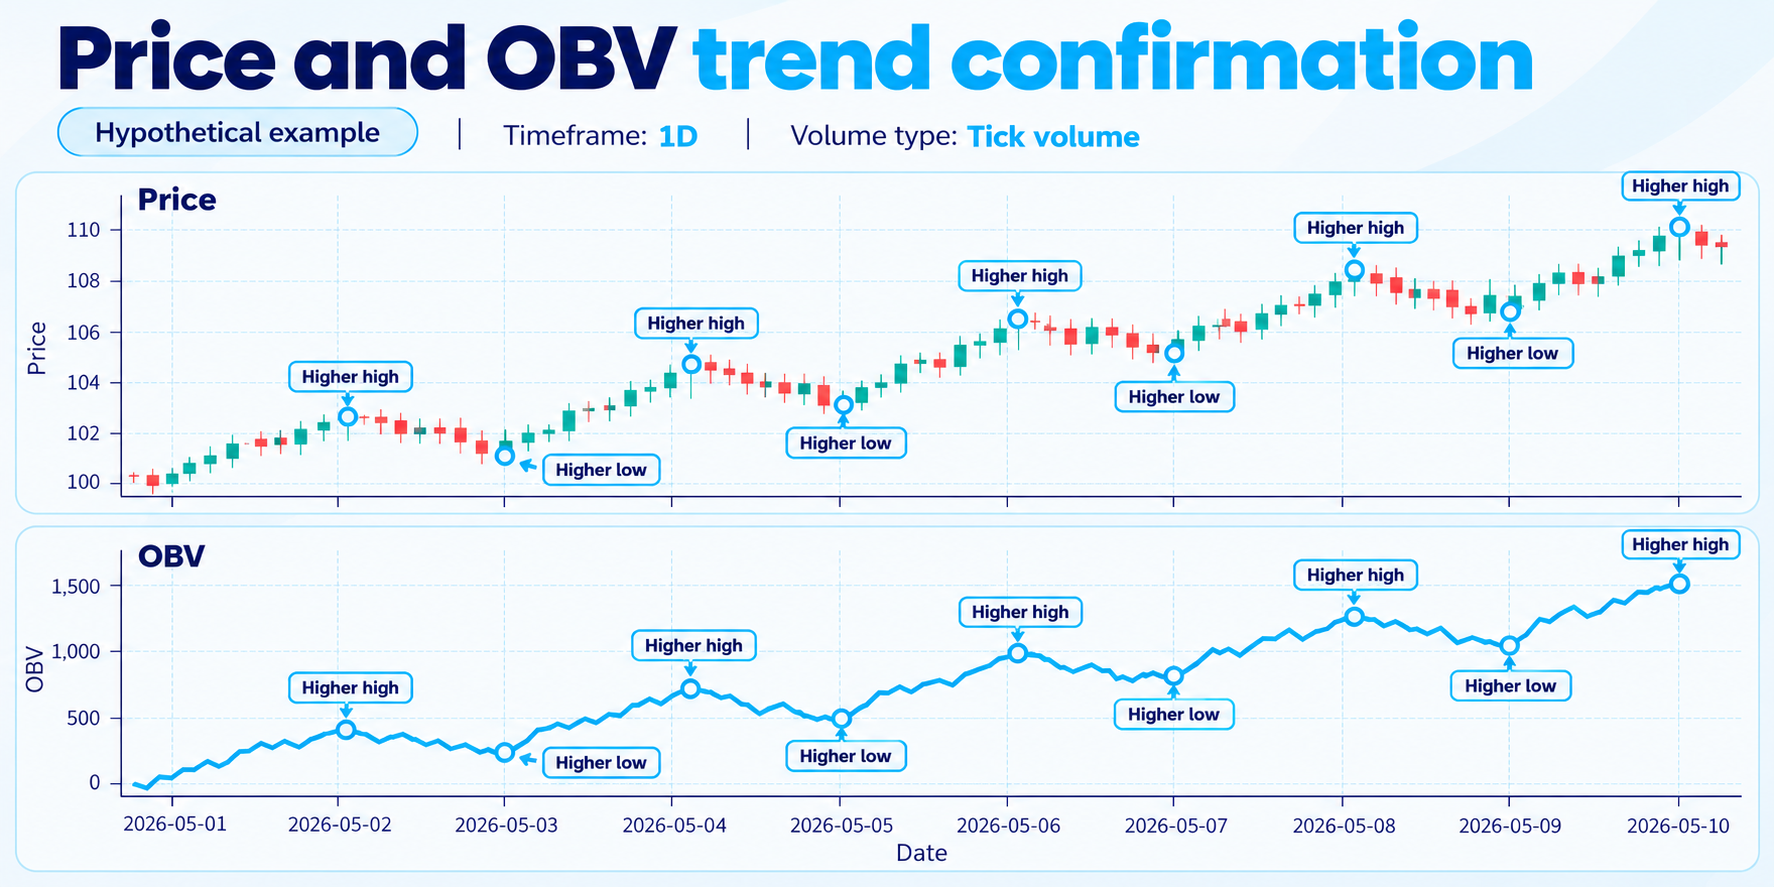
An OBV confirmation alone is not a trade trigger. Before reaching a decision, traders consider it together with price structure, support and resistance levels, and other analytical tools.
Bullish OBV Divergence Shows Improving Volume Beneath Weak Price
A lower low in price alongside a higher low in OBV at the corresponding point creates bullish OBV divergence. Although price appears weak, the underlying volume picture is improving. This can suggest that selling pressure is easing before the change becomes apparent in price.
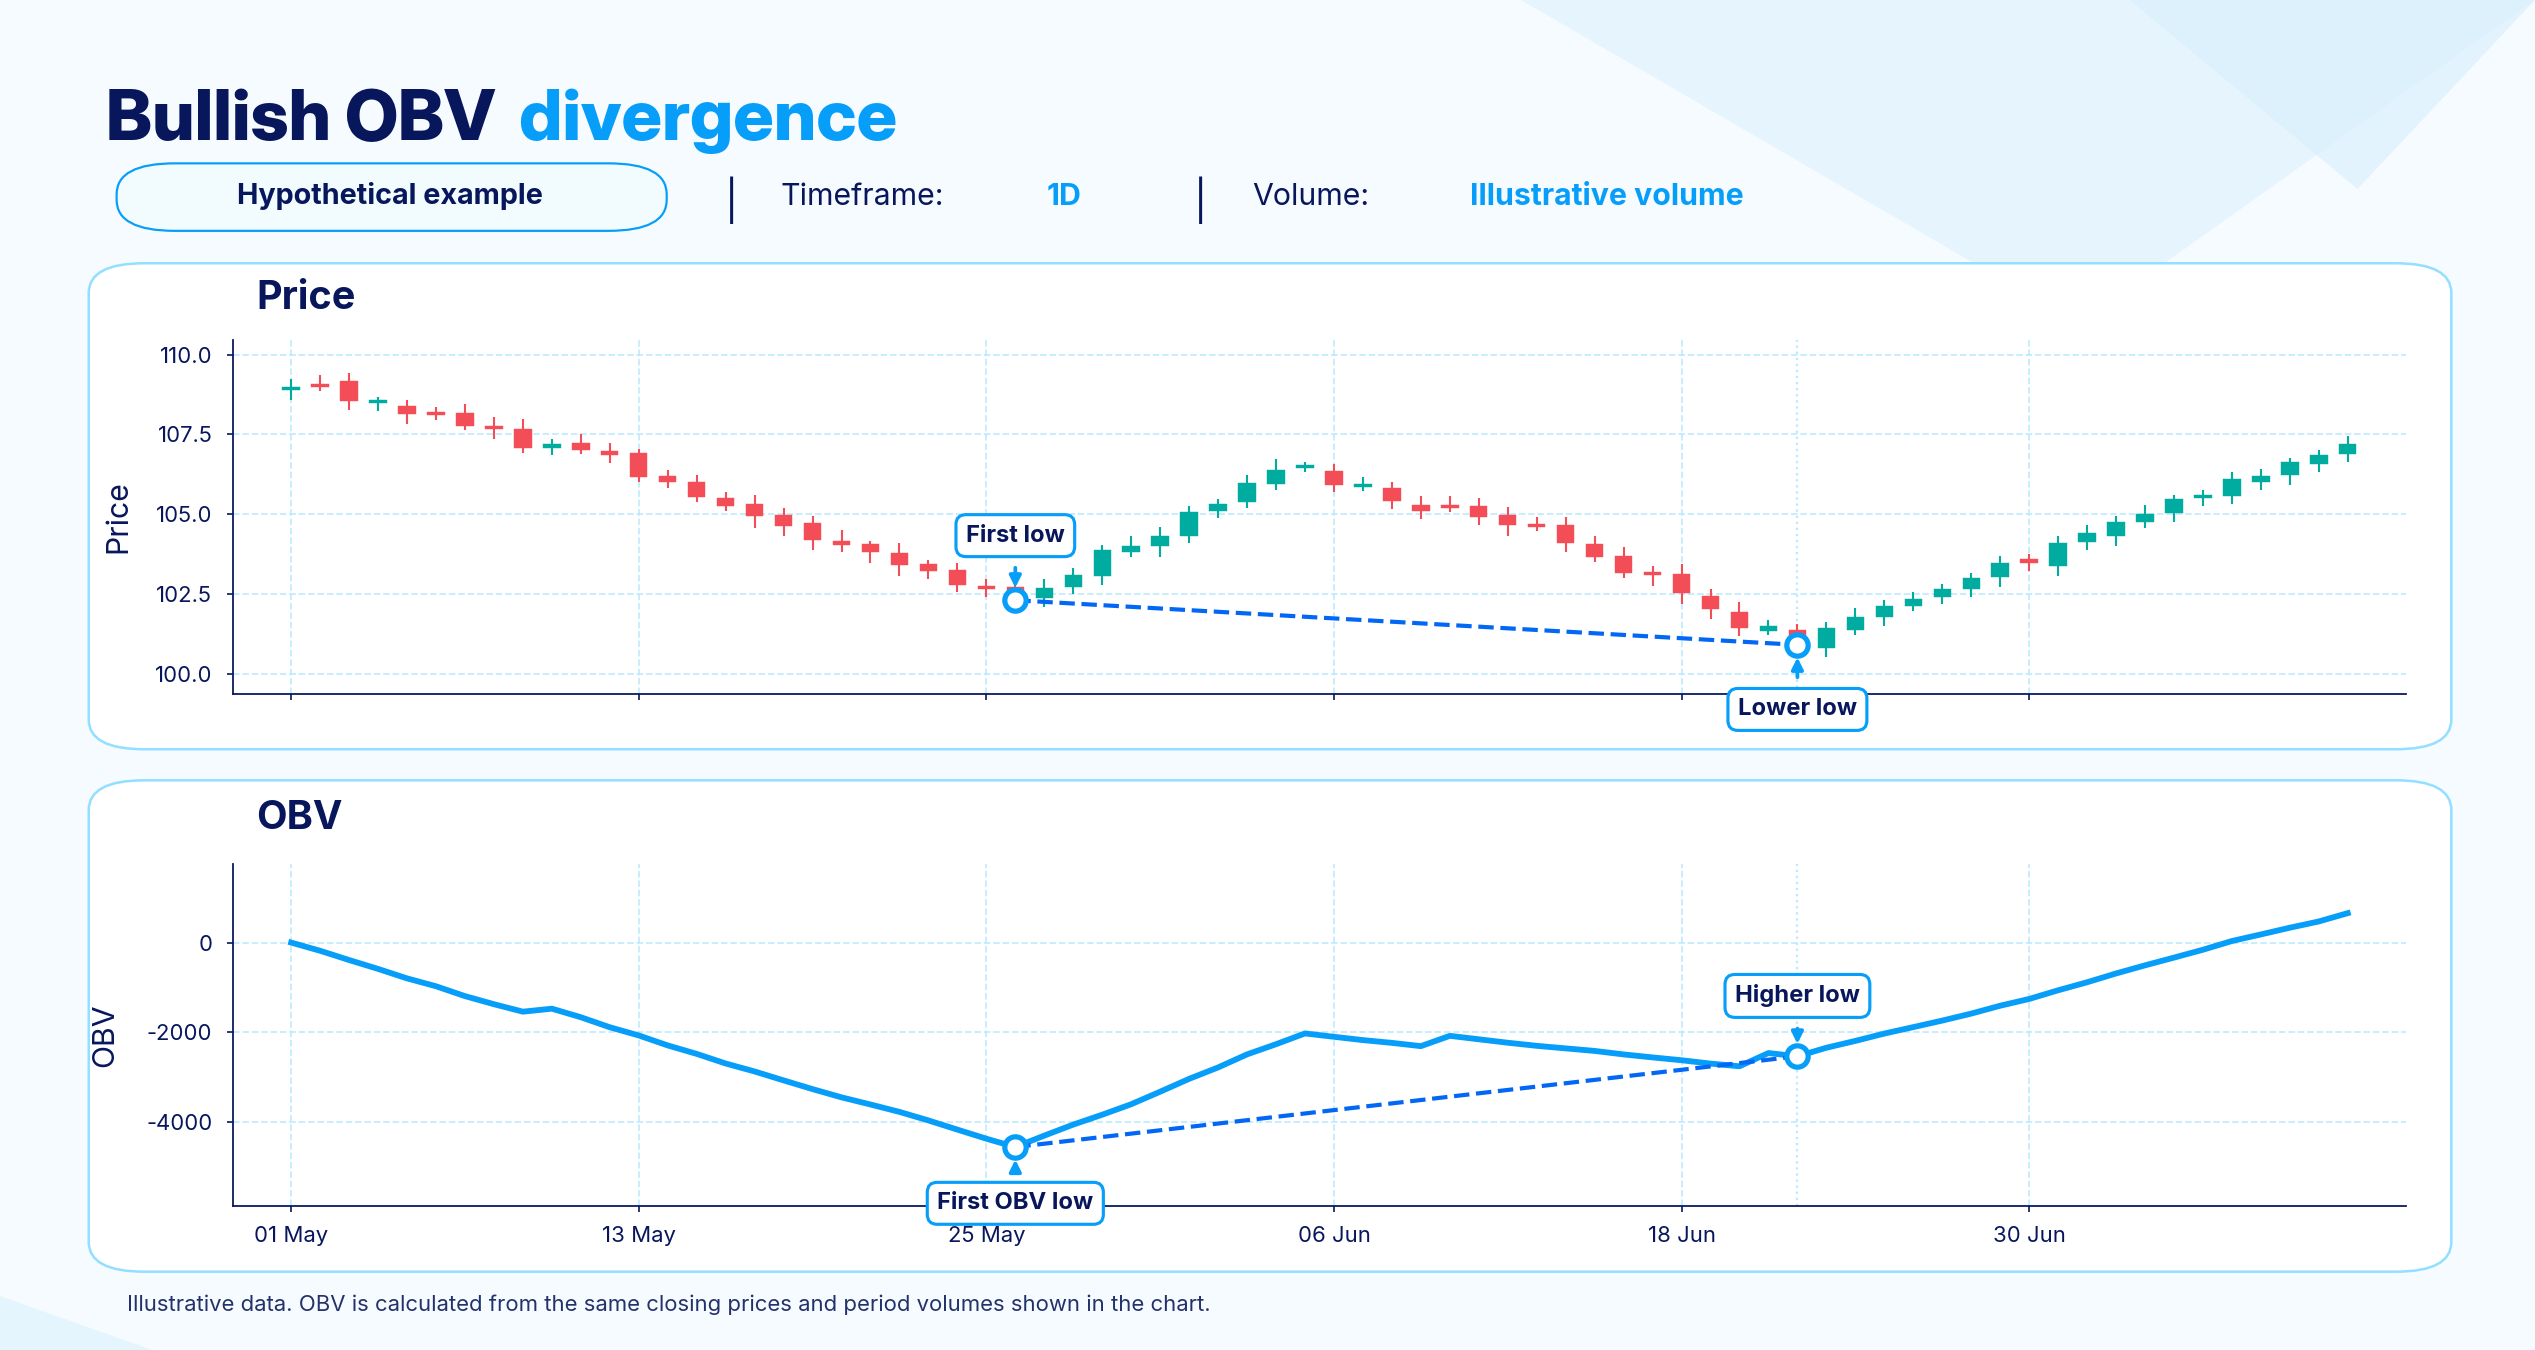
Identifying this chart pattern does not, by itself, provide sufficient confirmation. Traders generally look for price to validate the change, perhaps by breaking above a recent swing high, before regarding the divergence as anything beyond an early warning.
Bearish OBV Divergence Reveals Fading Support Beneath Strong Price
A higher high in price paired with a lower high in OBV at the corresponding point constitutes bearish OBV divergence. The apparent strength in price is accompanied by weakening volume support, which can indicate that buying pressure is being exhausted before price reverses.
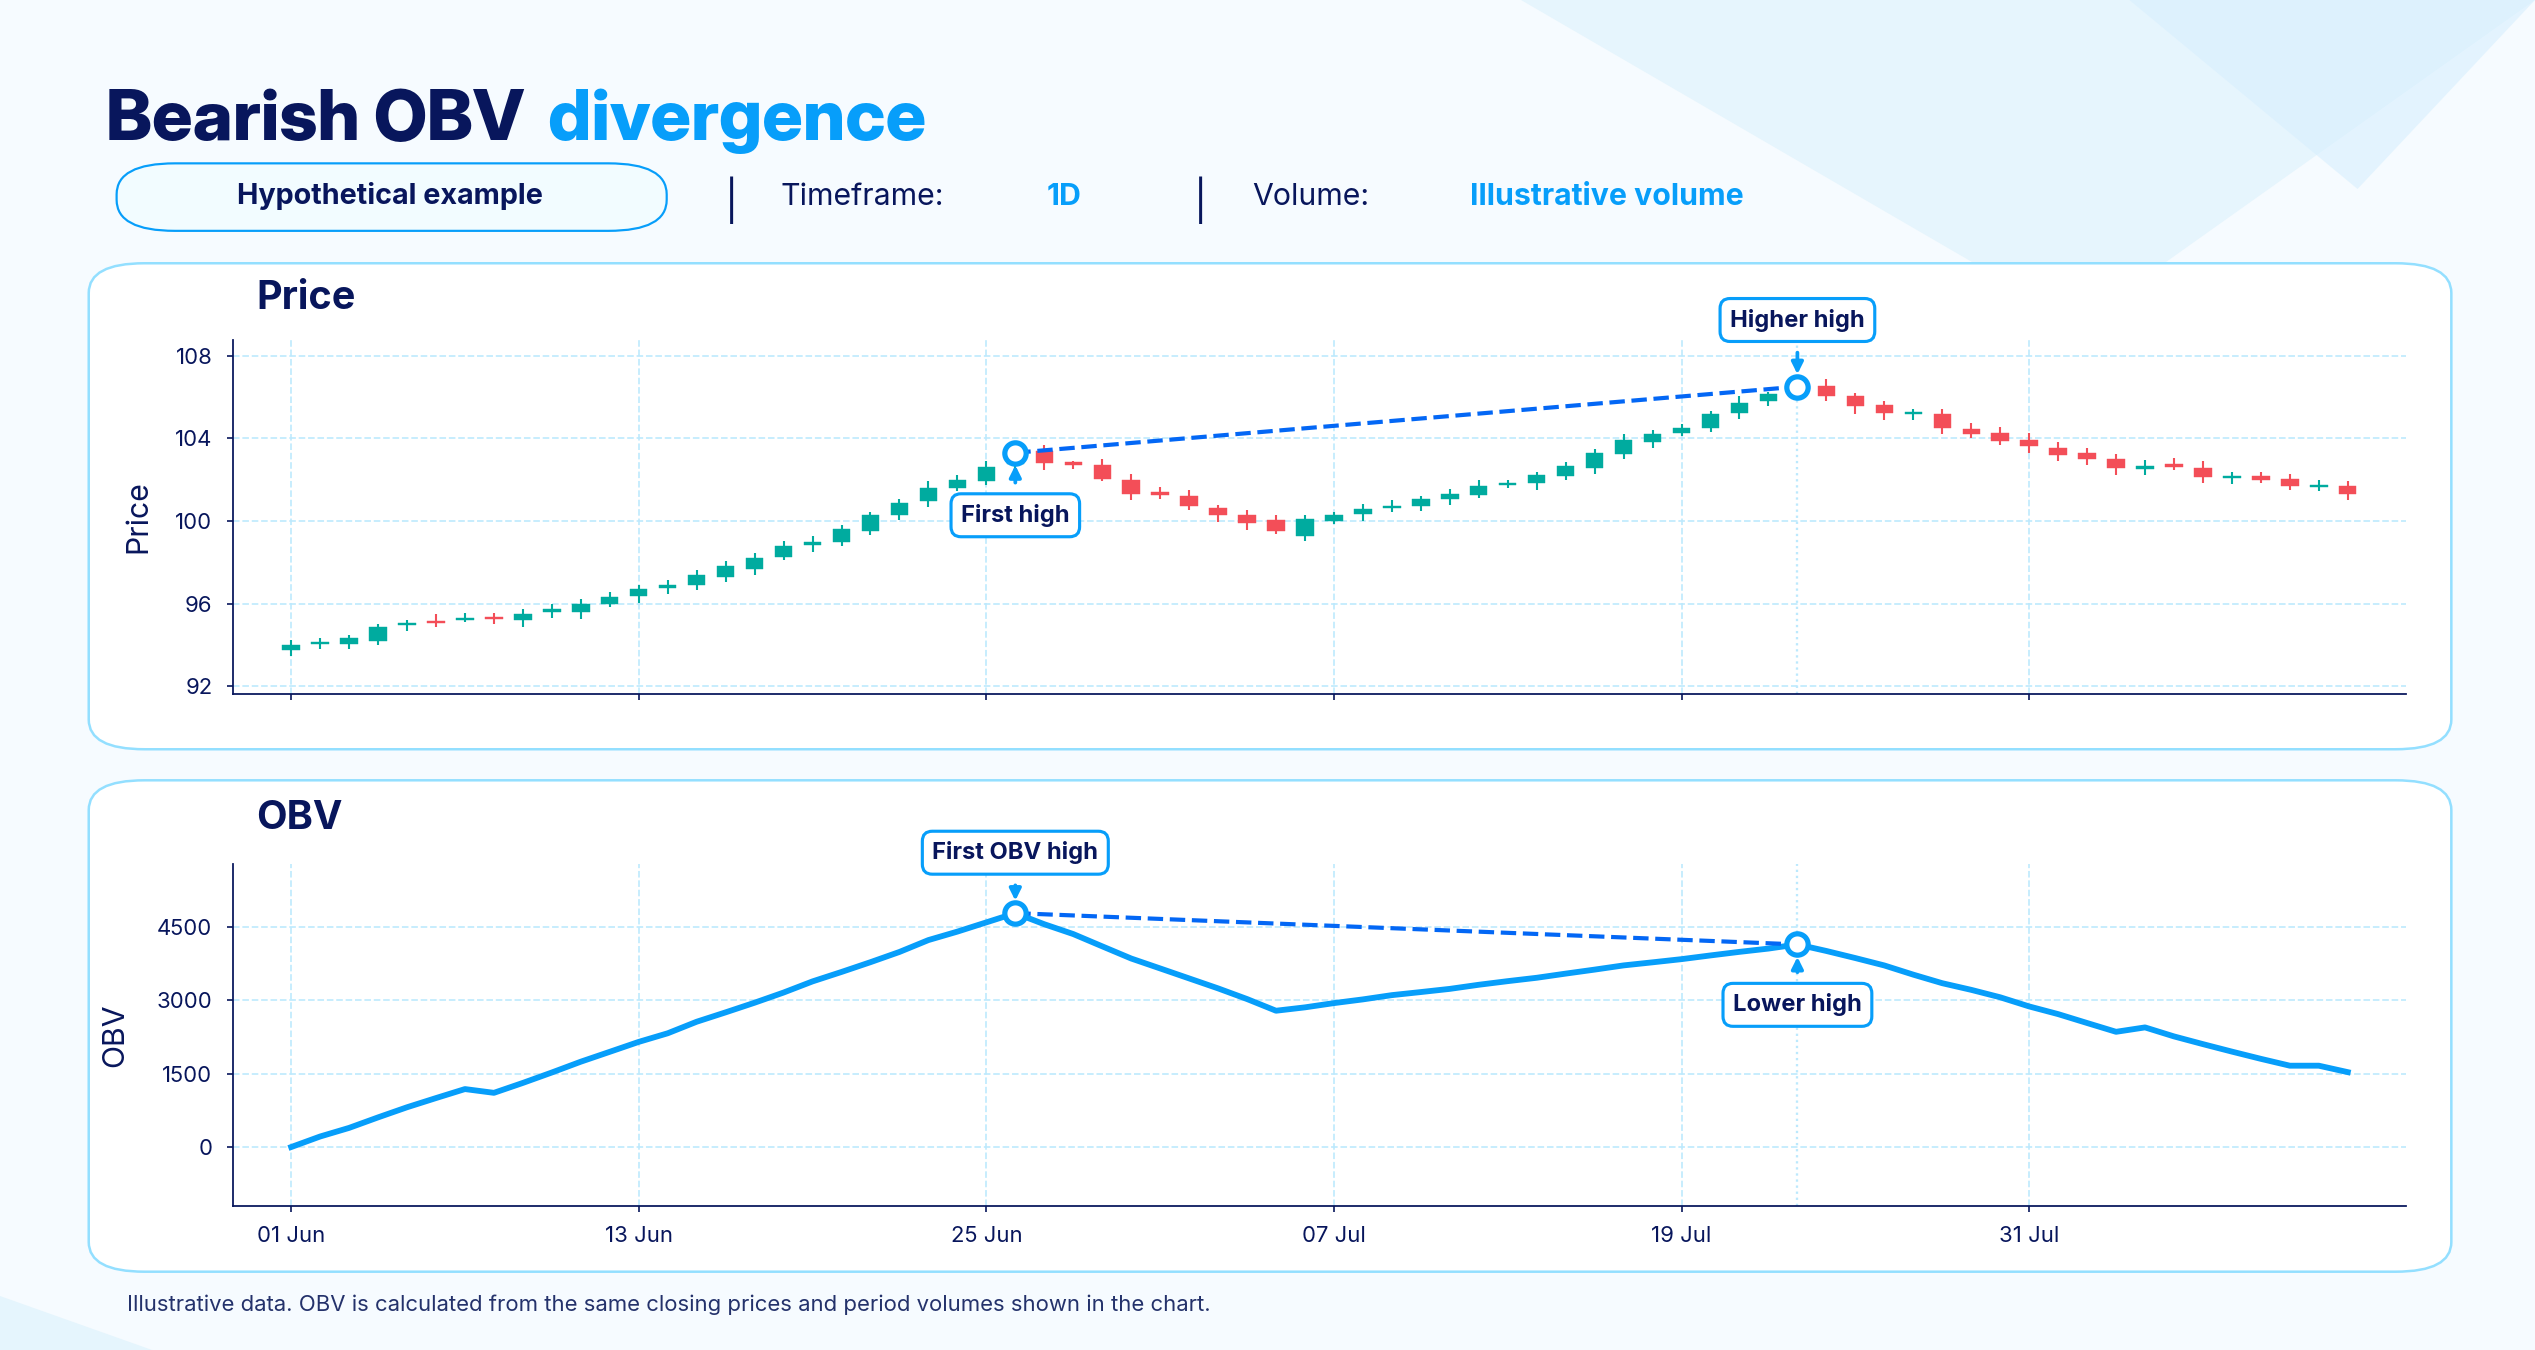
Rather than timing a reversal, this pattern highlights a warning. Price and OBV may remain divergent for a considerable period before price changes direction, and a reversal may never materialise.
OBV Adds Volume Context to Price Analysis
Price analysis gains a volume-based cross-check from OBV that price alone cannot supply. A price line moving higher or lower reveals direction; the accompanying OBV line indicates whether actual volume backs that movement. This context offers three principal benefits.
Confirming the trend. When OBV and price move together, they reinforce the view that a trend is more credible if actual volume supports it, rather than merely a handful of large trades moving the price.
Warning early through divergence. Divergence from price can reveal the volume pressure underlying a move, helping traders identify waning buying or selling pressure before price responds.
Applying across markets. With only closing prices and volume required for its formula, OBV can be used for stocks, forex pairs and other liquid markets with available volume data.
OBV Has Four Principal Limitations
Before placing reliance on OBV, traders need to consider four important limitations.
Misleading signals. OBV may move sharply following one large trade or a brief surge in volume, even when underlying buying or selling pressure has not genuinely changed.
News- and expiry-related volume surges. Volume generated by earnings announcements, economic releases or contract expiries may bear little relation to the surrounding trend, temporarily distorting the OBV line.
Uneven data quality. A single centralised volume measure does not exist for forex and certain other markets. Reliability therefore depends on the volume feed used by the chart, an issue examined more closely later in the article.
Equal weighting regardless of price-move size. Whether the closing price changes substantially or only marginally, the entire volume figure is added or deducted. A minor price movement can consequently have the same weight in the calculation as a major one.
These constraints make OBV most useful alongside price structure and at least one additional tool, rather than as an independent signal. As a lagging indicator, it validates developments already recorded in price and volume; it cannot forecast the next direction of price.
Trading With On-Balance Volume Starts With Price Context
A straightforward sequence underpins the use of OBV: establish the price context, compare the indicator with price action, assess confirmation or divergence, and consider conflicting signals. It can also complement wider beginner day trading strategies that set out entry, exit and risk management rules.
Establish the price picture first. Before consulting OBV, identify the prevailing trend, trading range or important level on the price chart. Price provides the context that makes OBV meaningful; the indicator is not meaningful alone.
Align the OBV and price comparison periods. Check whether the highs and lows in OBV correspond to those in price or begin to diverge. This establishes whether volume and the trend are moving together.
Assess whether OBV confirms or diverges. Moves in tandem suggest strengthening trends, whereas separation between price and OBV can indicate weakening ones. Such divergence warrants attention as a warning, not as a trigger to enter.
Consider disagreements between signals. A conflict between OBV and another tool, such as a moving average or price action, calls for caution rather than the dismissal of either reading.
OBV Supports Trend, Breakout and Pressure Assessments
When a trend, possible breakout or potential change in buying and selling pressure needs a second assessment, OBV can help. Three common applications follow.
Evaluating trend support. Comparing the direction of OBV with price helps establish whether actual trading volume backs the trend.
Monitoring a possible breakout. An OBV rise before or during a price breakout suggests that volume is accumulating behind the move.
Identifying divergence in price and volume. Opposing directions in price and OBV can highlight a loss of trend strength.
If OBV is inconclusive or the market's volume data is incomplete, give price greater weight and OBV less weight in that decision. Its contribution depends on a clear reading and dependable underlying volume data; it is not equally useful in all circumstances.
Price Action and Moving Averages Provide Context for OBV
A small set of complementary tools is generally more useful than relying entirely on OBV. Candles, support, resistance and chart patterns reveal through price action what buyers and sellers have actually agreed to pay. To identify possible turning points, traders often consult price-action reversal candlestick patterns. OBV supplies the volume perspective, indicating whether genuine participation supports the move. Meanwhile, a moving average consolidates price into a smoother trend line, making direction clearer than raw price alone. Adding a volume moving average allows current volume to be compared with its recent baseline while OBV indicates direction. The timeframe selected can also alter the interpretation.
Agreement across all three produces a stronger picture than any individual tool. For instance, price might break resistance as OBV rises and price remains above an upward-sloping moving average. Disagreement also carries useful information: a breakout to higher prices accompanied by a stalled OBV suggests that volume or trend support may be insufficient to sustain it. This calls for caution, not automatically a trade against the breakout.
An On-Balance Volume Strategy Uses Trend Confirmation
The illustrative OBV strategy below centres on confirming trends. Its purpose is educational, showing how the components work together, rather than presenting a system with a guaranteed edge. In liquid markets offering reliable volume data, such as major forex pairs or heavily traded stocks, OBV acts as a filter to validate the trend before a price signal is acted upon.
OBV Trend Confirmation Follows Defined Conditions
An established price trend. Price must already be trending, for instance through successive higher highs and higher lows during an uptrend.
Matching confirmation from OBV. Across the corresponding swings, OBV must likewise record higher highs and higher lows, following the direction of price.
A supplementary filter. A second confirmation comes from price being on the appropriate side of the selected moving average. In an uptrend, for example, it would be above a rising 50-period moving average.
Conditions for passing on a setup. Do not take the setup if OBV is flat or diverges from price, the instrument's volume data is sparse or unreliable, or a forthcoming major news event could distort the volume readings.
Entry, Exit and Invalidation Follow Specific Criteria
Within the established uptrend outlined above, a fresh price swing high accompanied by a fresh OBV swing high provides a possible entry trigger. The stop-loss is placed beneath the latest swing low on the price chart, with its distance determined by the trader's risk tolerance and position size.
Possible exits include a previously defined profit target, a trailing stop or an unambiguous price reversal signal. Invalidation occurs if the next swing brings divergence between OBV and price, price closes below the moving-average filter again, or the wider trend context alters.
These levels do not constitute universal settings for all instruments and timeframes. They demonstrate the relationships between the strategy's components, with individual traders adapting them to their risk tolerance and the market concerned.
An OBV Trading Example Shows Confirmation in Practice
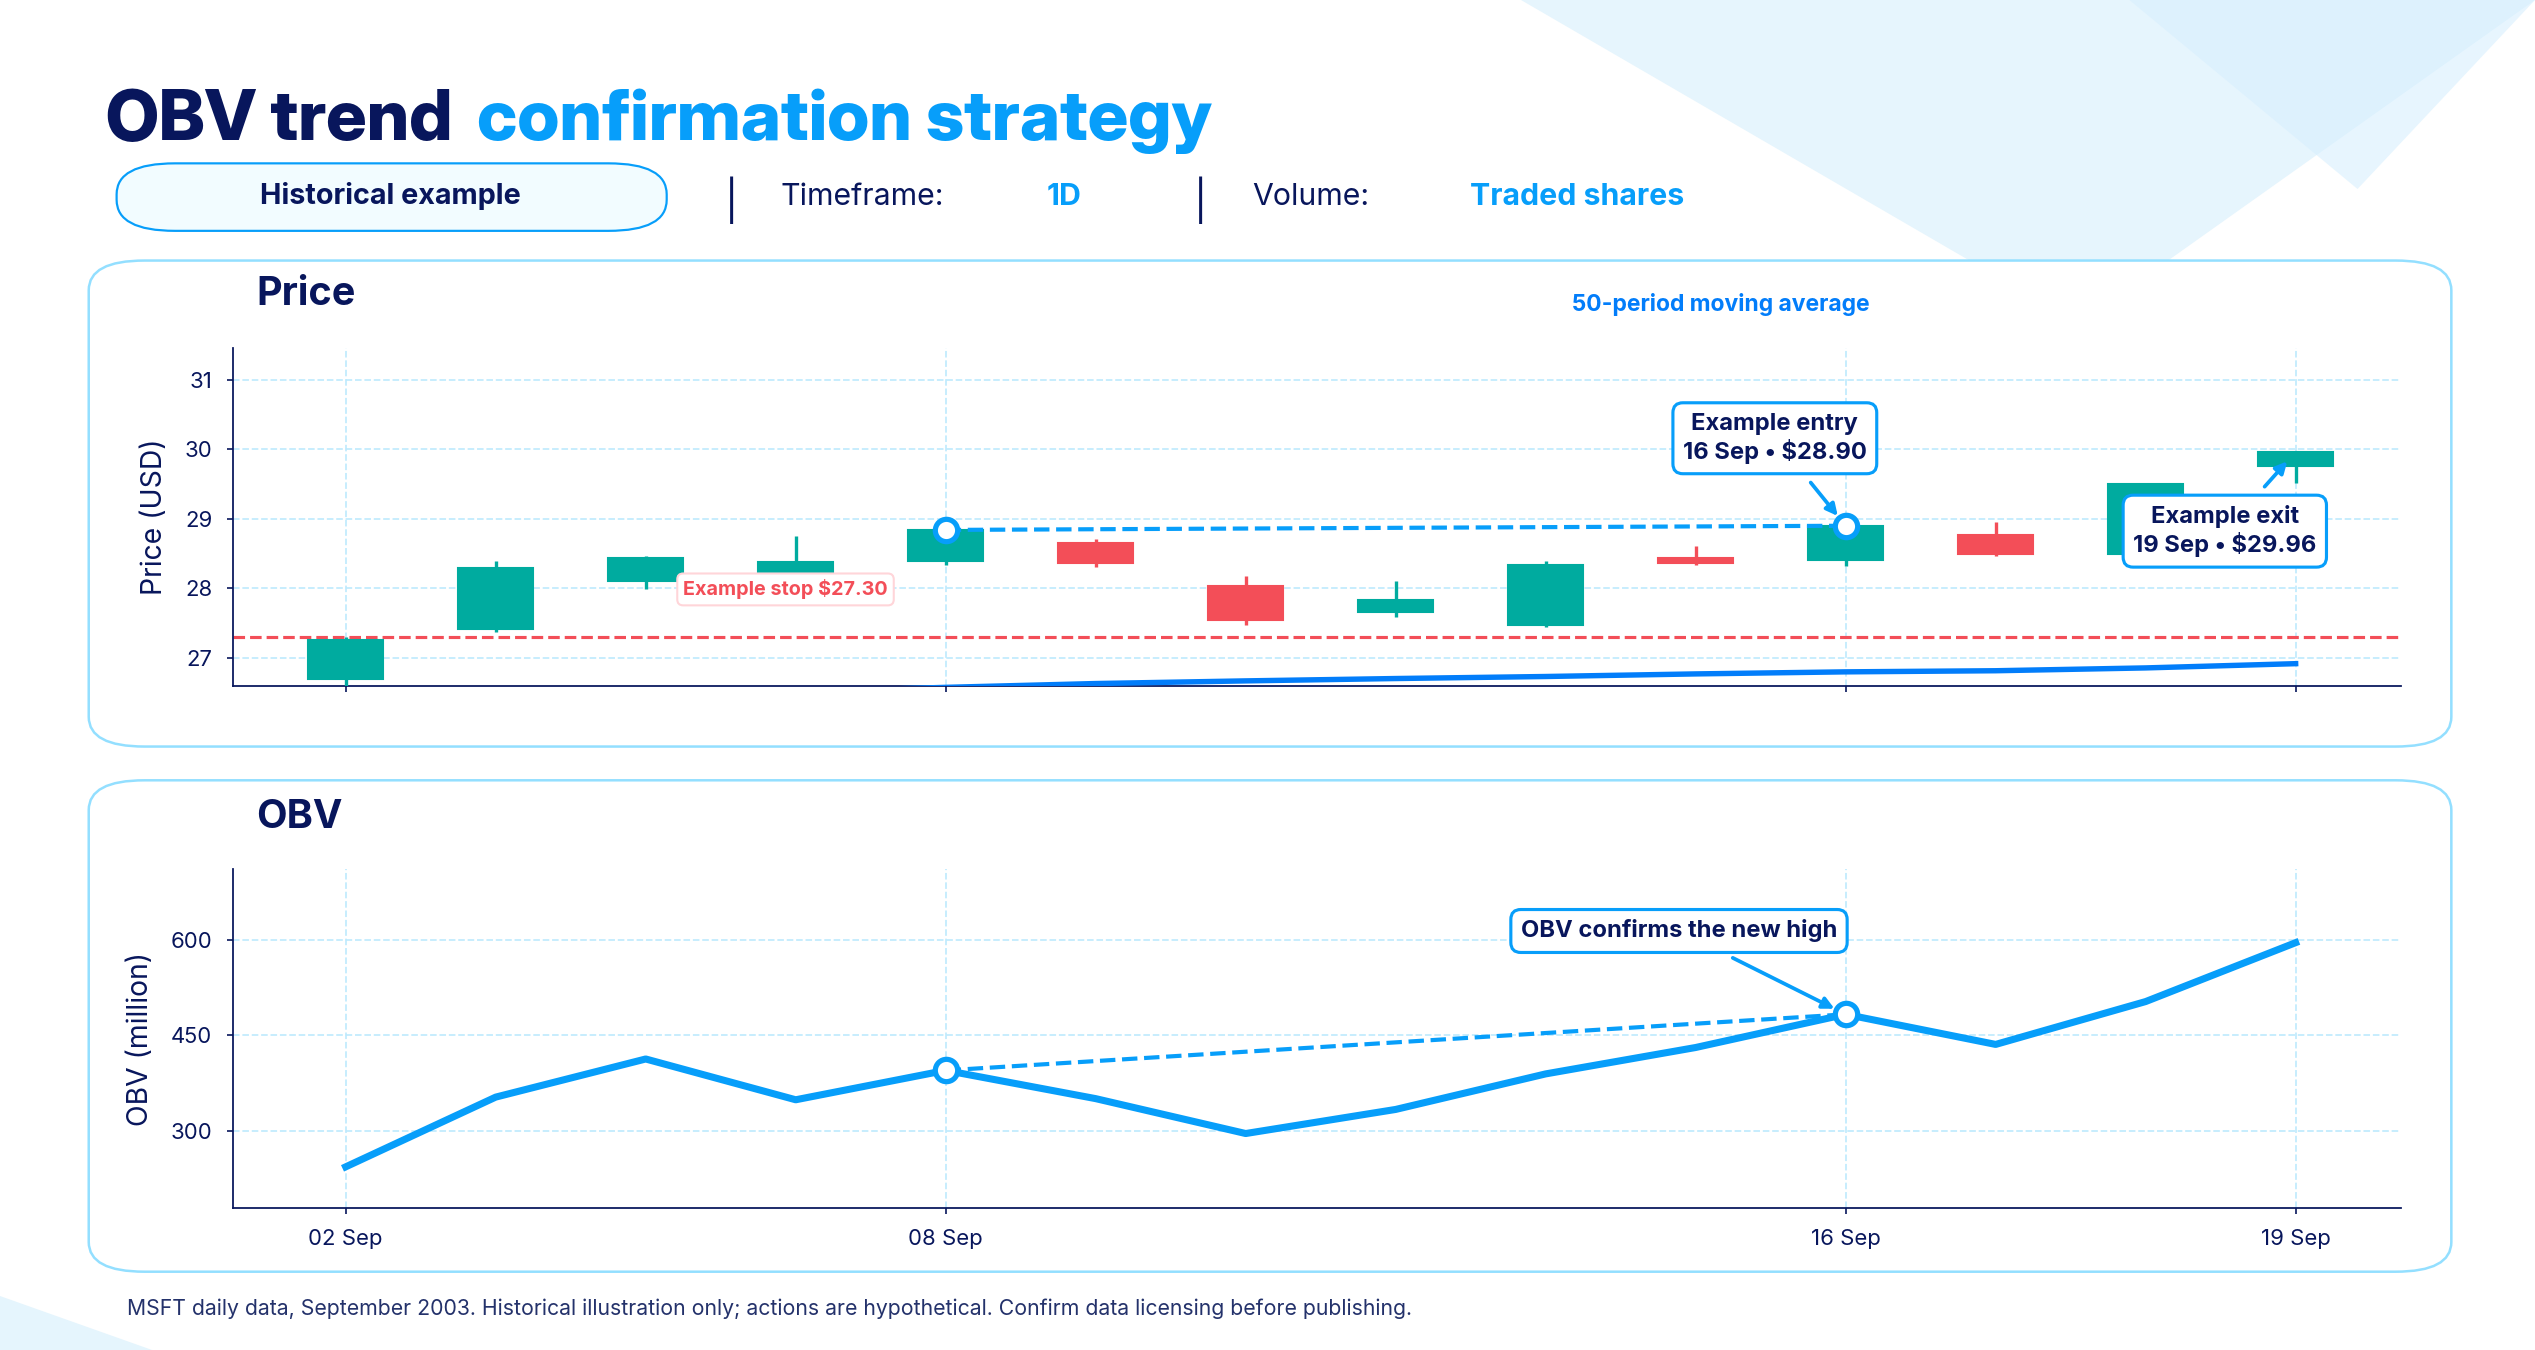
Consider the setup in sequence. While remaining above the selected moving average, price establishes a higher low before exceeding the previous swing high. At approximately the same time, OBV records a corresponding higher low and then exceeds its own previous swing high, validating the price move.
Without OBV confirmation, the setup is not triggered. For example, a price breakout accompanied by a flat or declining OBV is interpreted as insufficient volume support for the trend. Rather than forcing a trade, the trader waits for another setup.
MT4 and MT5 Provide Built-In OBV Setup Options
The instructions here apply to the desktop editions of MT4 and MT5; their mobile and web versions may involve slightly different steps. Before adding the indicator, traders without MT4 installed can access a dedicated MetaTrader 4 download and trading configuration.
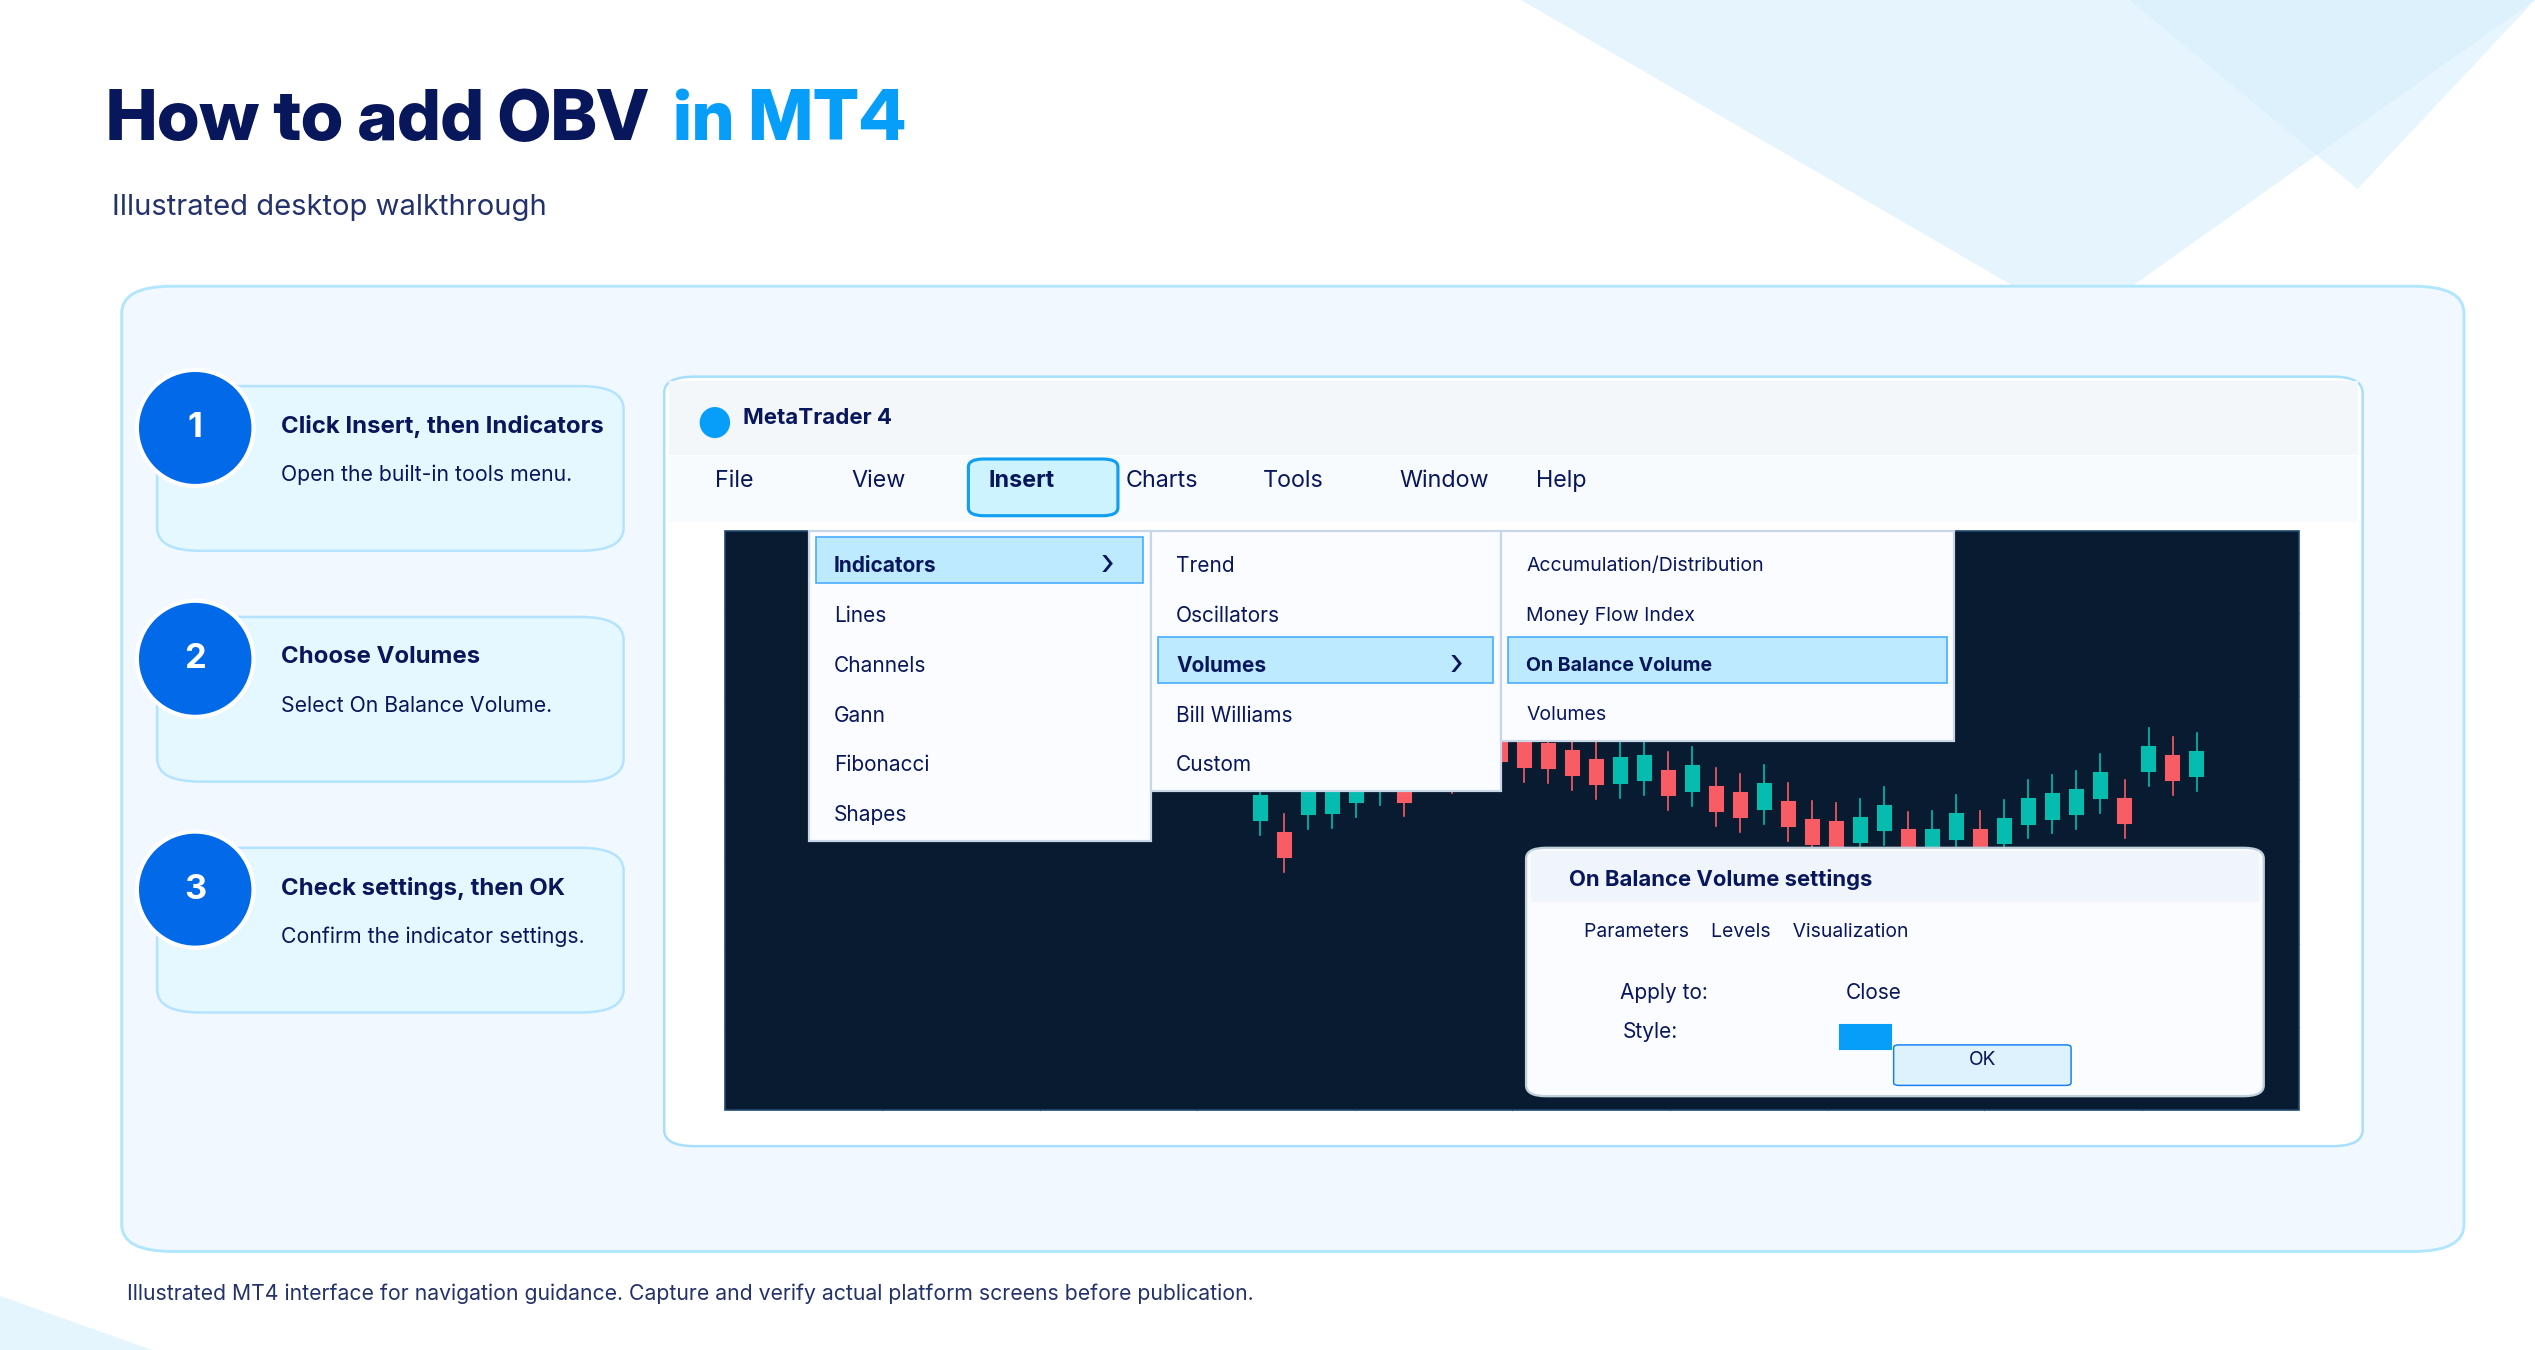
Adding OBV to MT4. With the relevant instrument's chart open, select Insert from the top menu, followed by Indicators, Volumes and On Balance Volume. OBV appears in a separate window beneath the price chart. Before confirming, you can change its colour, line style and volume type.
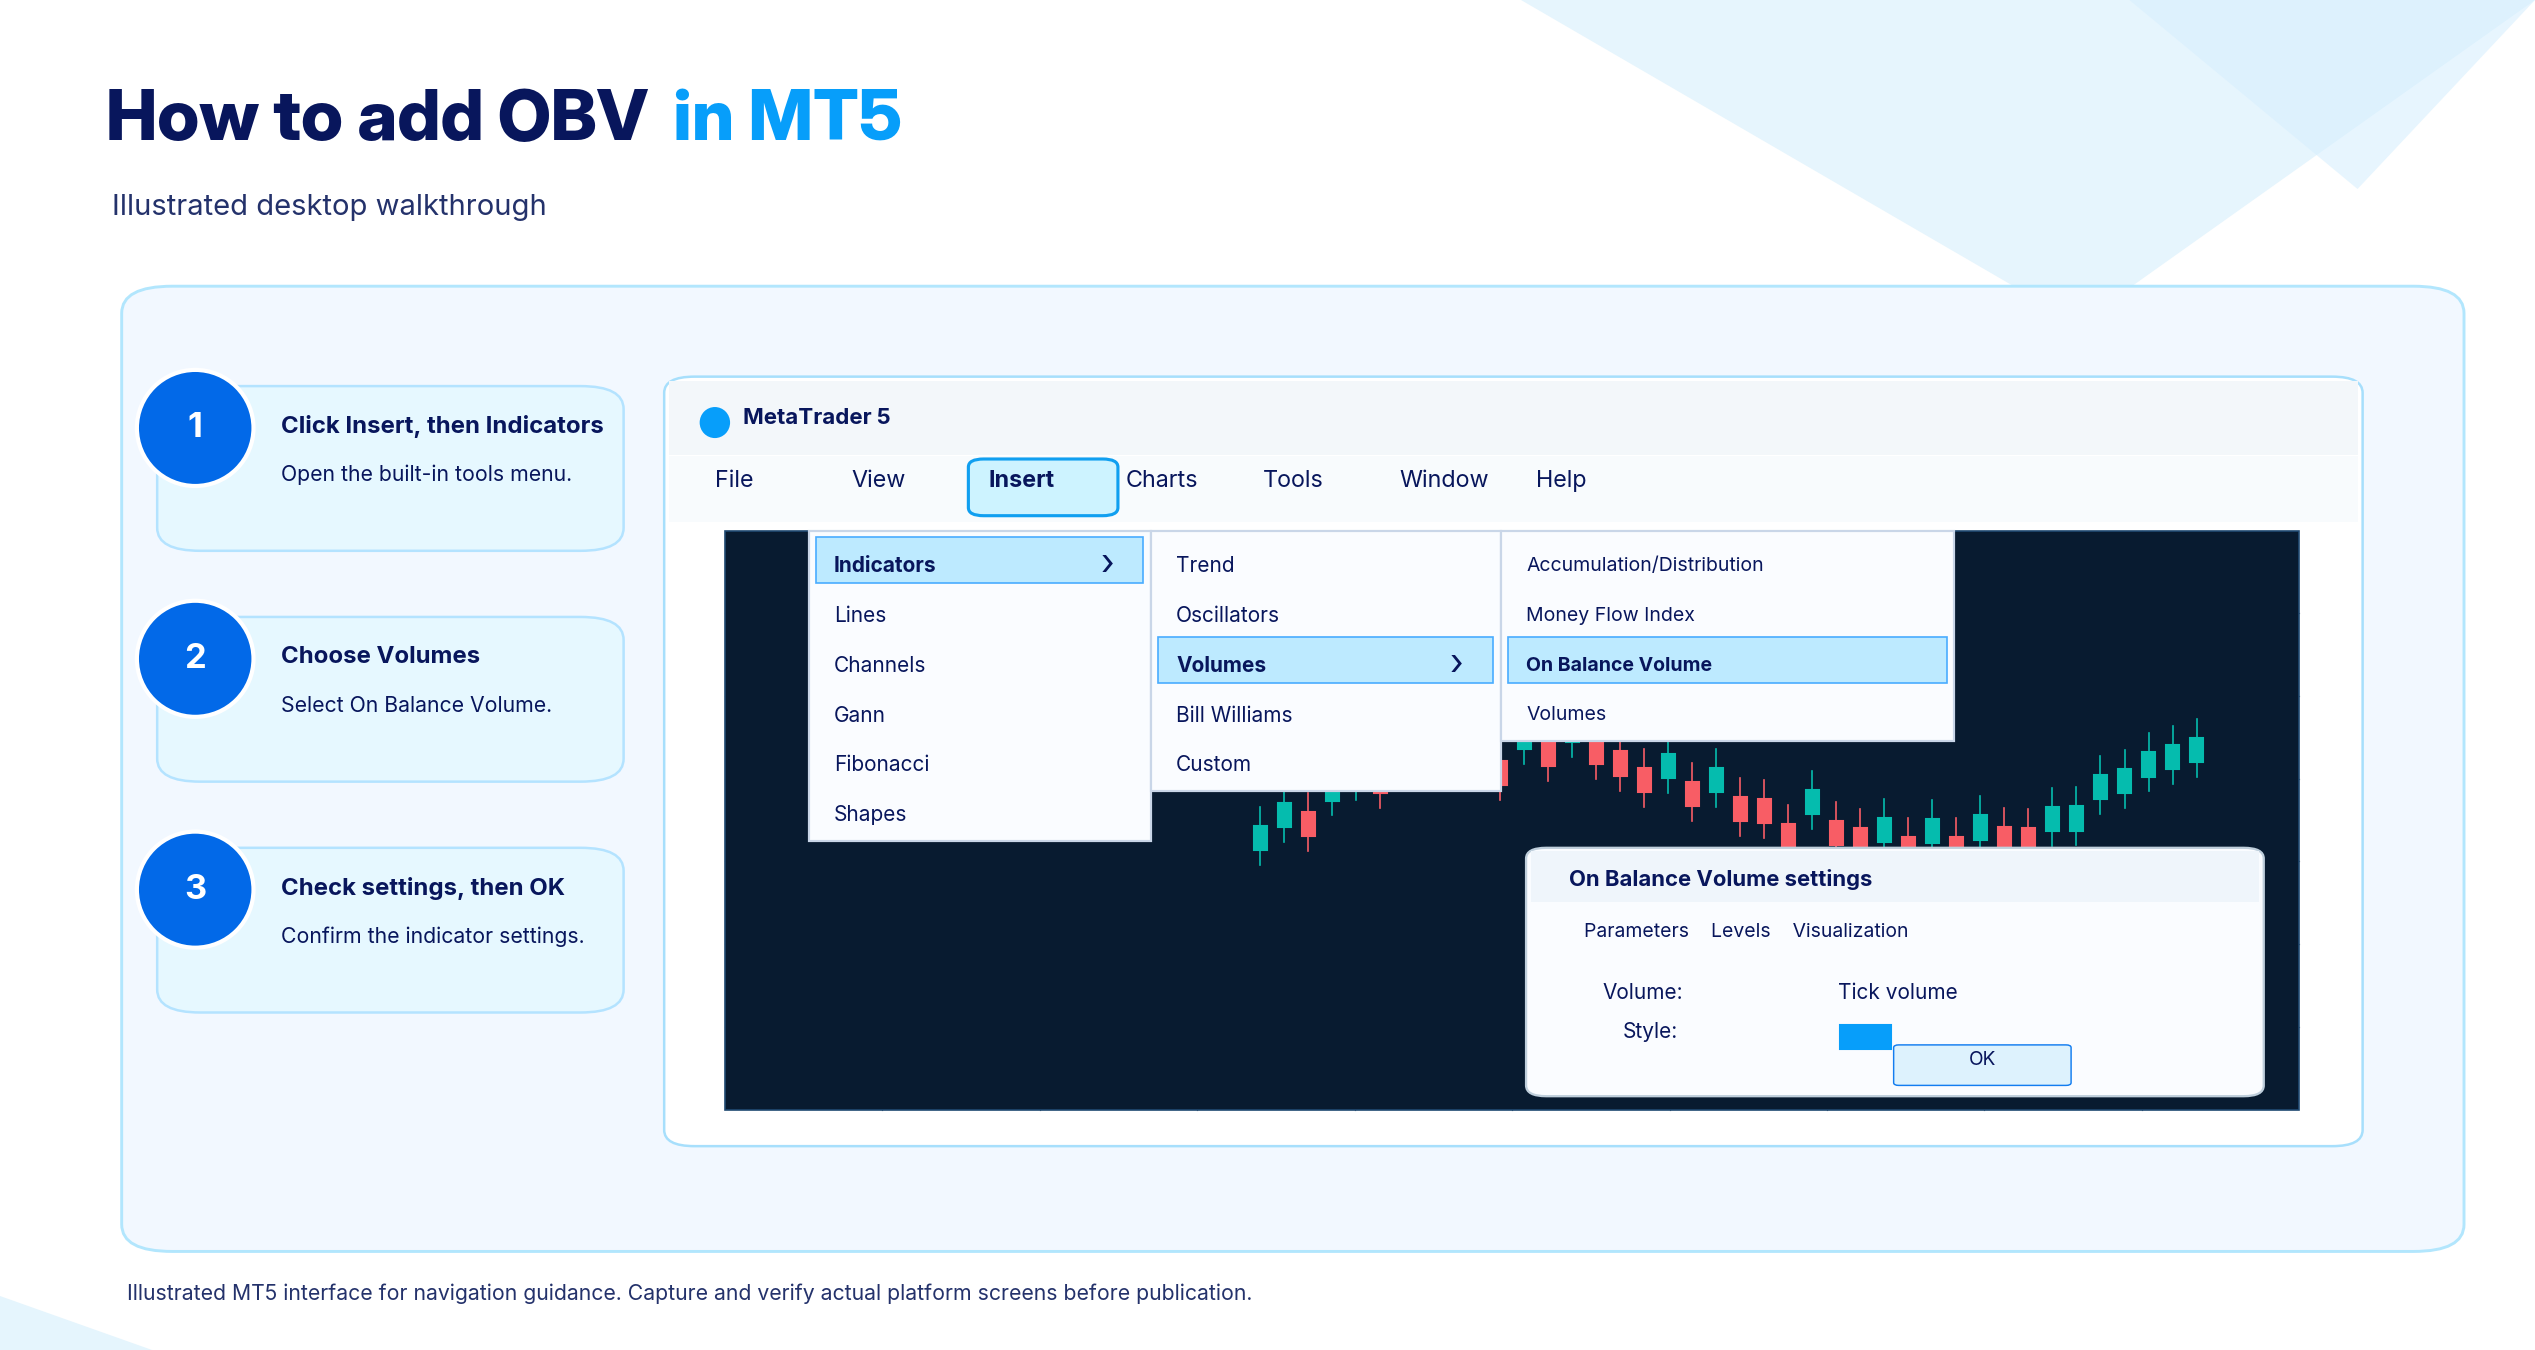
Adding OBV to MT5. With a chart open for the instrument you wish to analyse, choose Insert in the top menu, then Indicators, Volumes and On Balance Volume. Alternatively, drag OBV from the Navigator window onto the chart. Both routes bring up the same settings window, allowing the applied volume type and line appearance to be changed before confirmation.
Forex and Gold Require a Different Approach to OBV
The way OBV behaves on forex and gold differs from its behaviour on an exchange-traded stock, owing to differences in how these markets record volume.
Tick Volume and Traded Volume Measure Different Activity
The number of price changes during a period constitutes tick volume, rather than the quantity traded. Traded volume, by contrast, records the actual contracts, shares or lots exchanged over that period.
Because forex operates through a decentralised network of brokers and liquidity providers, no individual feed records the entire global market's traded volume. Tick volume therefore serves as a proxy on most forex charts, including MT4 and MT5 charts.
Establish which type of volume underpins OBV before using it on a chart. In MT4 and MT5, the indicator settings identify this as the applied volume. For forex it is generally tick volume; for other instruments it may be tick or real volume, according to the broker's data feed.
A gold CFD or gold traded through a forex-style broker normally displays that broker's tick volume, rather than centralised futures-exchange volume. Consequently, OBV based on one broker's ticks will differ from a reading calculated using another broker's feed for the same instrument, although the line's shape is usually similar. Readings for forex and CFD gold should be treated as useful indicators of direction, not precise measurements of worldwide trading volume.
On-Balance Volume, Price Volume Trend and Accumulation/Distribution Use Different Calculations
Both on balance volume and the Accumulation/Distribution Line express volume as a cumulative line. However, their different treatment of individual periods often produces different readings. Comparisons with the money flow index indicator and price volume trend indicator are also common, as each combines volume and price differently.
Comparison Point | On Balance Volume (OBV) | Accumulation/Distribution Line (ADL) |
Calculation method | Uses the comparison between successive closes to add or deduct the entire period's volume, leaving the total unchanged if the closes match | Uses the closing price's position within the period's high-low range to add or deduct part of that period's volume |
How price is handled | Considers only the direction from one close to the next, disregarding the closing price's position within the period | Considers each period's high, low and close, weighting volume according to the closing price's proximity to either extreme |
How volume is handled | Adds or deducts the entire volume for each period | Adds or deducts a proportion of volume according to where the close falls within the range |
Reading the indicator | Compares the line's rises, falls and divergence with swings in price | Uses a broadly similar interpretation, although different inputs drive the movement |
Principal constraints | Disregards both the magnitude of the price change and the close's position within the period's range | May still fail to reflect actual buying or selling pressure if a strong directional move ends with a close near the range's midpoint |
Different treatment of price allows OBV and the Accumulation/Distribution Line to move in opposite directions on the same chart over the same period. Neither takes precedence. Considering them together offers a broader view of volume behaviour than either alone, and disagreement calls for closer examination of price action rather than automatically favouring one indicator. Price and volume are used by the MFI to assess buying and selling pressure, whereas PVT adjusts volume in proportion to the price change. It also follows money flow. For added context, some traders combine it with a volume-based average price reference, such as VWAP. Relative to OBV, tools such as the Klinger Volume Oscillator place greater emphasis on relating volume to price reversals.
Common OBV Questions Addressed
OBV Confirms Price Moves Rather Than Predicting Them
Forecasting price is not OBV's function. Its inputs are closing prices and volume already recorded, making it a lagging indicator that confirms a move once those data are available rather than anticipating the next one. A change such as emerging divergence is treated by traders as an early warning to monitor, not a guarantee that price will follow.
A Higher OBV Reading Is Not Necessarily More Bullish
A larger OBV figure does not in itself indicate bullish conditions. Since the calculation's starting point entirely determines its absolute value, two charts for the same instrument may display markedly different figures yet convey the same directional picture. The relevant information is the line's upward or downward movement and its swing points relative to price, rather than the magnitude of the reading.
OBV Remains a Lagging Indicator
Every OBV reading relies on closing prices and volume already recorded, which makes the indicator lagging. Some traders attribute leading characteristics to it when divergence from price emerges before a visible price response. This refers to an interpretation that a signal might precede a price move, not to the calculation itself, which always draws on existing historical data.
Closed-Period OBV Readings Do Not Repaint
Once a period has closed, its closing price and volume fix the corresponding OBV value, so the indicator does not repaint past readings. For a candle still in progress, the displayed value can continue to fluctuate as volume arrives before the close. This is normal behaviour, not repainting.
Historical readings can nevertheless shift if a broker corrects erroneous data or a platform recalculates following a feed problem. Any claim about repainting on a particular platform or with a particular broker should be checked directly with that provider.
Crypto OBV Reflects Its Exchange or Data Feed
Crypto can be analysed using OBV, but the result represents only the volume supplied by the chart's particular exchange or data feed. Trading takes place across numerous exchanges without a single consolidated volume measure. An OBV calculation based on one exchange therefore cannot represent total market volume.
Compared with the same instrument on a higher-volume exchange, a substantial move on a thinly traded exchange may yield a misleading OBV reading. Identifying the exchange or feed supplying a chart's volume is therefore just as important for crypto as for forex.