

Trading
Explore a wide range of markets with competitive pricing, deep liquidity, and advanced trading tools.
Learn More 
Platform
Trade seamlessly with TMGM's powerful platform, built for speed, precision, and a superior trading experience.
Learn More Trading Platform
Academy
Learn the fundamentals of trading with beginner-friendly resources, including guides, webinars, and market insights.
Learn More News & Analysis
Get real-time market updates and expert analysis to stay ahead of trading opportunities
Learn More News & Analysis
About
Learn what sets TMGM apart — our global presence, regulatory strength, and commitment to innovation in trading.
Learn More Why Choose TMGM
Sponsorship
1.3968 six-week lows tested: USD/CAD Price Forecast as US Dollar weakens
- Below 1.3960, USD/CAD reaches fresh six-week lows. The pair falls for a third consecutive day.
- Stronger demand for US Treasury bonds drives yields sharply lower, weighing on the US Dollar.
- Oil prices close to five-month highs fuel a Canadian Dollar rally
1.3968 marks the six-week low USD/CAD is testing. Friday brings a third consecutive daily decline for the US Dollar (USD) against the Canadian Dollar (CAD). Risk aversion is driving US Treasury yields down, while elevated oil prices support the commodity-sensitive Canadian Dollar. The pair is heading for a loss of more than 2% over a three-week sell-off.

Disappointing results from Google Alphabet have revived fears of an AI bubble. During the US and Asian sessions, investors have moved out of equities and into the safety of US Government Bonds. The retreat in US Treasury yields has deepened, with the US 10-year yield down more than 30 basis points in October, adding to downward pressure on the Greenback.
By contrast, expensive oil, Canada’s main export, continues to underpin the Loonie. Brent Oil holds above 112.00 per barrel and is on course for a monthly gain of nearly 20%. The US and Iran remain far from reaching a peace agreement, while attacks continue on vessels trying to pass through the Strait of Hormuz.
Technical Analysis: 1.3900 in Focus Below 1.3968
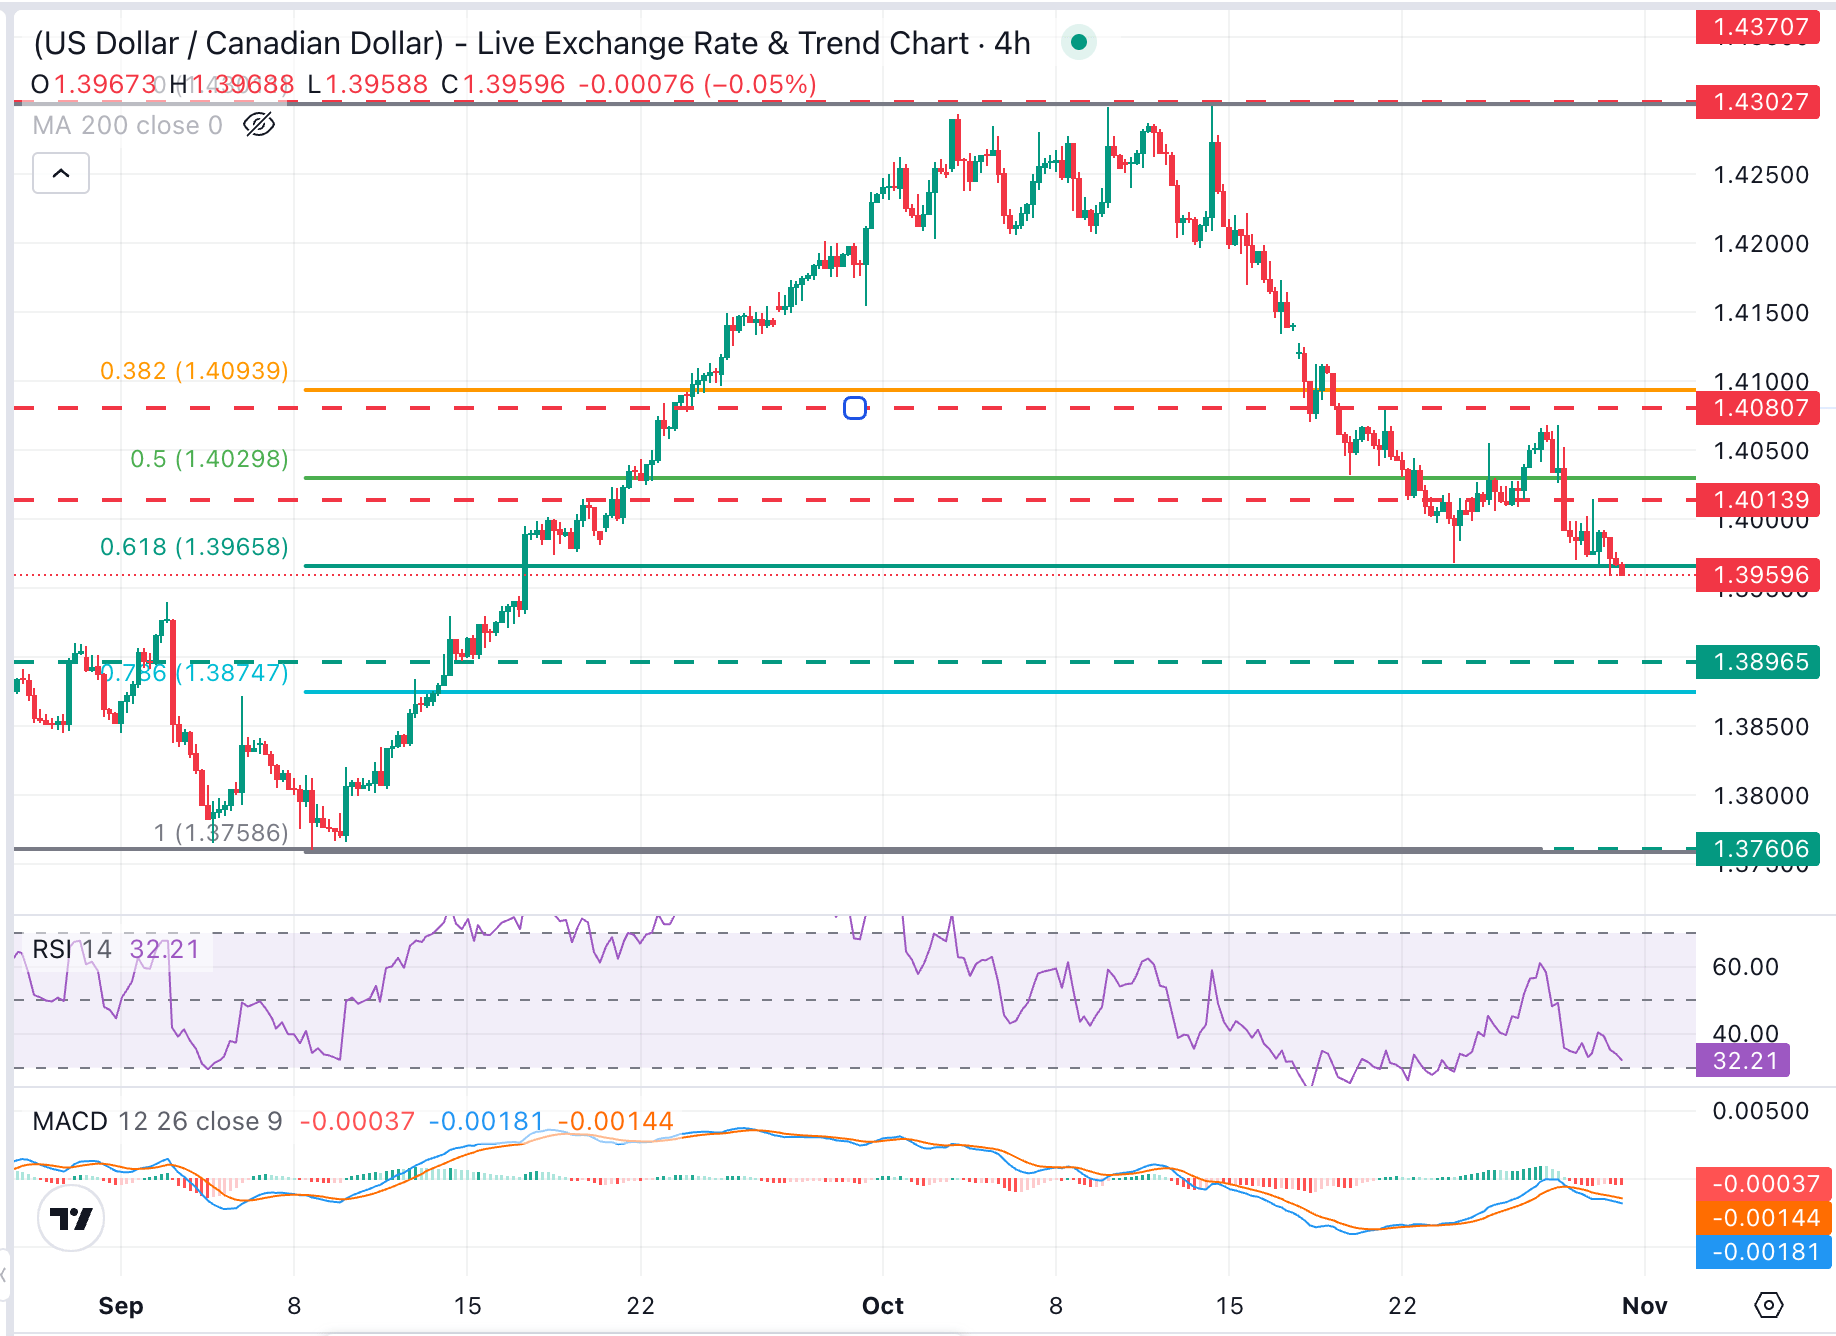
At around 1.3961, USD/CAD remains in a downtrend. On the 4-hour chart, the Relative Strength Index (14) stands at 32.5, close to oversold territory. The Moving Average Convergence Divergence (MACD) sits just below zero, signalling that sellers retain full control.
If a break below support around 1.3968, the October 23 low, is confirmed, attention would shift to the mid-September lows near 1.3900. The 78.6% Fibonacci retracement around 1.3875 would also come into view.
To relieve downward pressure, buyers would need to clear Thursday’s high near the psychological 1.4000 level, followed by the October 21 and 23 highs in the 1.4070-1.4080 zone.
(The technical analysis of this story was written with the help of an AI tool. Know more.)
Canadian Dollar: Today’s Currency Performance
Today’s percentage moves in the Canadian Dollar (CAD) against the listed major currencies appear in the table below. Its strongest performance was against the US Dollar.
| USD | EUR | GBP | JPY | CAD | AUD | NZD | CHF | |
|---|---|---|---|---|---|---|---|---|
| USD | -0.16% | -0.39% | -0.27% | -0.21% | -0.02% | -0.17% | -0.38% | |
| EUR | 0.16% | -0.23% | -0.11% | -0.04% | 0.16% | -0.02% | -0.22% | |
| GBP | 0.39% | 0.23% | 0.13% | 0.19% | 0.38% | 0.22% | 0.00% | |
| JPY | 0.27% | 0.11% | -0.13% | 0.07% | 0.25% | 0.09% | -0.11% | |
| CAD | 0.21% | 0.04% | -0.19% | -0.07% | 0.18% | 0.03% | -0.18% | |
| AUD | 0.02% | -0.16% | -0.38% | -0.25% | -0.18% | -0.16% | -0.36% | |
| NZD | 0.17% | 0.02% | -0.22% | -0.09% | -0.03% | 0.16% | -0.20% | |
| CHF | 0.38% | 0.22% | -0.01% | 0.11% | 0.18% | 0.36% | 0.20% |
Percentage movements between the major currencies are displayed in the heat map. Select the base currency in the left-hand column and the quote currency in the top row. For instance, choosing the Canadian Dollar on the left and following its row across to the US Dollar gives the percentage change for CAD (base)/USD (quote) in the corresponding cell.
POPULAR ARTICLES
1Bitcoin Weekly Forecast: BTC falls under pressure from Binance security breach and hawkish Fed2Japanese Yen: Upside hedge potential against US Dollar despite range-bound trading – BBH3$4,000 gives way: gold retreats despite risk-off sentiment as hawkish Fed expectations weigh4Crypto Today: Selling pressure eases in Bitcoin, Ethereum, XRP following Binance security breach5ECB’s Nagel: Central bank will act decisively to lower inflation if needed6Dogecoin Price Forecast: ETF outflows and long unwinding heighten downside risk for DOGE70.4% Eurozone GDP growth in Q3 exceeds 0.2% estimates8US Dollar: Rate hike expectations gain support from stronger growth – Commerzbank91.3968 six-week lows tested: USD/CAD Price Forecast as US Dollar weakens


Get Started!
Sign up and access the Global Markets in less than 3 minutes

Connect With Us









Contacts
Phone: +61 2 8036 8388
Fax: +61 2 8036 8388
Email: support@tmgm.com



The information provided on this website is of a general nature only and does not constitute personal financial advice. Before acting on any information on this website, you should consider the suitability of the information in relation to your objectives, financial situation and needs. Investing in CFDs and FX Margin Contracts carries significant risks and is not suitable for all investors. You may lose more than your initial deposit. You do not own, or have, any interest in the underlying asset. We recommend that you seek independent advice and ensure you fully understand the risks involved before trading. It is important that you read and consider the disclosure document before you acquire any product listed on the website. The information and advertisements offered on this website are not intended for use by any person in any country or jurisdiction where such use would be contrary to local laws and regulations. The Products and Services offered on this website are not intended for residents of the United States, Malaysia and Thailand.
TMGM is authorized and regulated in various jurisdictions.
Trademax Australia Limited, trading as TMGM, is regulated by the Australian Securities and Investments Commission (ASIC), AFSL no. 436416 and is located at Level 28, One International Tower, 100 Barangaroo Avenue, 2000 Sydney, NSW Australia.
Email: support@tmgm.com.au
Trademax Global Limited, trading as TMGM, is authorized and regulated by the Vanuatu Financial Services Commission (VFSC), registration number 40356 and registered at 1276, Kumul Highway, Port Vila, Vanuatu, Republic of Vanuatu.
Email: support@tmgm.com
Trademax Global Markets (SE) Limited, trading as TMGM, is authorized and regulated by the Financial Services Authority (FSA) of Seychelles, with license number SD224. The company is registered at Office No 13, Providence Estate ABIS Centre, Mahe, Seychelles.
Email: support@tmgm.com
Trademax Global Markets (International) Pty Ltd, trading as TMGM, is authorized and regulated by the Financial Services Commission, Mauritius (FSC) with license no. GB22201012, and registered at 33, Edith Cavell Street C/o IQ EQ Fund Services (Mauritius) Ltd Port Louis, 11324 Mauritius.
Email: support@tmgm.com
Copyright © TMGM. All rights reserved