

Trading
Explore a wide range of markets with competitive pricing, deep liquidity, and advanced trading tools.
Learn More 
Platform
Trade seamlessly with TMGM's powerful platform, built for speed, precision, and a superior trading experience.
Learn More Trading Platform
Academy
Learn the fundamentals of trading with beginner-friendly resources, including guides, webinars, and market insights.
Learn More News & Analysis
Get real-time market updates and expert analysis to stay ahead of trading opportunities
Learn More News & Analysis
About
Learn what sets TMGM apart — our global presence, regulatory strength, and commitment to innovation in trading.
Learn More Why Choose TMGM
Sponsorship
AUD/USD Price Forecast: Antipodeans face pressure as oil prices climb
- 0.7000 nears as AUD/USD slides. Rising oil prices put pressure on the Australian Dollar.
- The risk of renewed Middle East escalation has increased following the withdrawal of US non-emergency personnel from the Gulf.
- October’s preliminary PMI releases from Australia and the US are in sharp focus for investors.
A 0.4% fall puts the Australian Dollar near the psychological 0.7000 level against the US Dollar (USD). On Thursday, the currency trails all its major peers apart from the New Zealand Dollar (NZD).

Australian Dollar: Today’s Performance
Today’s percentage moves in the Australian Dollar (AUD) against the major currencies listed appear in the table below. Its largest loss was against the Japanese Yen.
| USD | EUR | GBP | JPY | CAD | AUD | NZD | CHF | |
|---|---|---|---|---|---|---|---|---|
| USD | 0.30% | 0.23% | -0.85% | -0.03% | 0.48% | 0.55% | -0.32% | |
| EUR | -0.30% | -0.08% | -1.14% | -0.34% | 0.17% | 0.24% | -0.65% | |
| GBP | -0.23% | 0.08% | -1.07% | -0.30% | 0.24% | 0.31% | -0.56% | |
| JPY | 0.85% | 1.14% | 1.07% | 0.80% | 1.33% | 1.37% | 0.51% | |
| CAD | 0.03% | 0.34% | 0.30% | -0.80% | 0.52% | 0.60% | -0.29% | |
| AUD | -0.48% | -0.17% | -0.24% | -1.33% | -0.52% | 0.06% | -0.80% | |
| NZD | -0.55% | -0.24% | -0.31% | -1.37% | -0.60% | -0.06% | -0.84% | |
| CHF | 0.32% | 0.65% | 0.56% | -0.51% | 0.29% | 0.80% | 0.84% |
Percentage movements between major currencies are displayed in the heat map. Select the base currency in the left-hand column and the quote currency in the top row. Selecting the Australian Dollar on the left and reading across to the US Dollar, for example, gives the percentage change for AUD (base)/USD (quote) in the corresponding cell.
Fears of renewed escalation in the Middle East have driven oil prices sharply higher, putting risk-sensitive currencies under pressure. WTI Oil stands near $99.00 at the time of writing, a gain of 1.5%.
According to analysts at Commerzbank, Middle East tensions “intensified after a drone attack on Saudi Arabia's Shaybah oil field killed two people and injured two others,” although the eventual impact on crude remained contained. The analysts say “oil prices briefly jumped on reports suggesting a wider withdrawal of US diplomatic personnel from the Gulf,” but the rally faded after “Washington clarified that the order was limited to Saudi Arabia,” leading the market to trim its earlier gains.
A rebound in the US Dollar Index (DXY) is adding to pressure on AUD/USD. During European trading, the index has recovered to around 101.66 after retesting a three-week low near 101.45. The US Dollar Index (DXY) measures the Greenback against six major currencies.
Friday’s October flash private-sector PMI releases from Australia and the United States (US) are expected to provide the next catalyst for the Australian Dollar and the US Dollar.
AUD/USD Technical Outlook
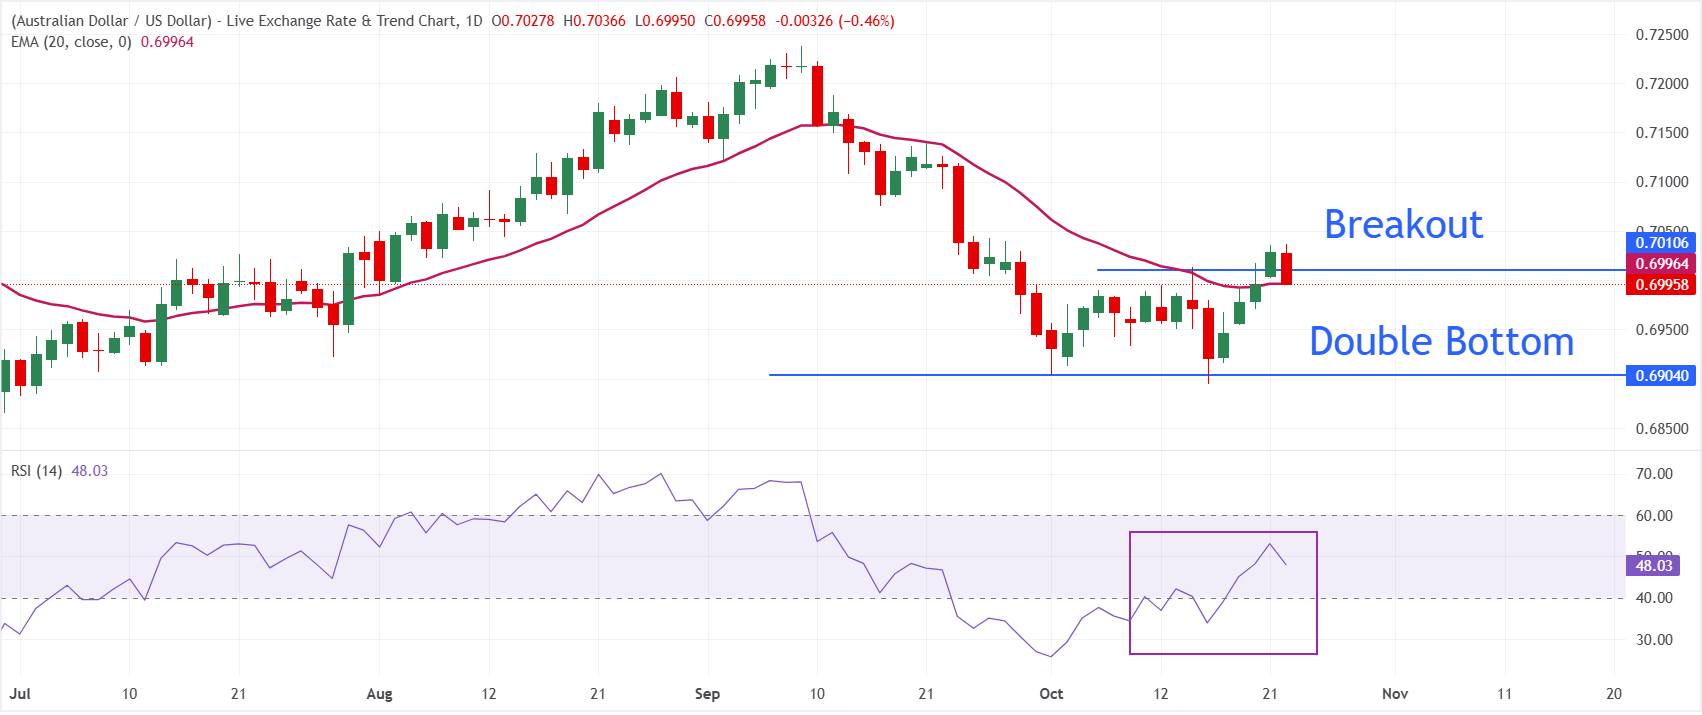
At 0.6996 on the daily chart, AUD/USD is sitting precisely on its 20-day exponential moving average (EMA), also near 0.6996. This makes the average a key pivot. Price fluctuations around this dynamic line leave the near-term bias neutral.
At 48, the Relative Strength Index (RSI) remains just under the 50 threshold, suggesting no clear directional momentum. Recent selling pressure has eased, but buyers have not yet re-established firm control.
Following a breakout from the Double Bottom formation, the pair remains pinned to its 20-day EMA. A sustained close above this pivot would give bulls scope to regain control and attempt a recovery towards earlier highs around 0.7036. Conversely, a break below the 15 October low of 0.6894 could start another leg lower in AUD/USD.
(The technical analysis of this story was written with the help of an AI tool. Know more.)
US Dollar: Key Questions
As the official currency of the United States of America, the US Dollar (USD) also circulates alongside local banknotes as the ‘de facto’ currency in a significant number of other countries. No currency is traded more widely. Data from 2022 show that it accounts for over 88% of global foreign exchange turnover, equivalent to average daily transactions of $6.6 trillion. The USD replaced the British Pound as the world’s reserve currency after the Second World War. Gold backed the US Dollar for most of its history, until the Bretton Woods Agreement in 1971 brought the Gold Standard to an end.
Monetary policy set by the Federal Reserve (Fed) is the single biggest influence on the US Dollar’s value. The Fed pursues two mandates: price stability, through inflation control, and full employment. Adjusting interest rates is its main means of meeting both objectives. Inflation above the Fed’s 2% target, with prices increasing too rapidly, prompts the central bank to raise interest rates, supporting the USD. By contrast, inflation below 2% or an excessively high Unemployment Rate may lead the Fed to cut rates, putting pressure on the Greenback.
When conditions become extreme, the Federal Reserve can create more Dollars through quantitative easing (QE). This process sharply expands the supply of credit within a financial system that has become blocked. QE is an unconventional policy response to a credit shortage caused by banks refusing to lend to one another for fear of counterparty default. It serves as a last resort when interest-rate cuts alone are unlikely to deliver the required outcome. During the Great Financial Crisis in 2008, the Fed used it as its preferred tool to address the credit crunch. Under QE, the Fed prints additional Dollars to purchase US government bonds, mainly from financial institutions. The policy typically weakens the US Dollar.
The reverse of quantitative easing is quantitative tightening (QT). Under QT, the Federal Reserve ceases bond purchases from financial institutions and does not reinvest principal repaid on its maturing bond holdings in new purchases. This generally supports the US Dollar.
POPULAR ARTICLES
1French spreads pose downside risk for Euro against US Dollar – BBH2European Central Bank: Communication focus as French spreads widen – Nordea3194K: US Initial Jobless Claims fell last week4Swiss Franc: Safe-haven risks to funding role - Societe Generale5$100 Breakout in Buyers’ Sights: WTI Oil Price Forecast as upward pressure mounts61.1200 gives way as Euro retreats, French yields climb and Oil tests five-month highs7$1.30 Support Tested: Ripple (XRP) price forecast as protocol defers bug fix to November8January hike remains in focus for Japanese Yen after hawkish BoJ hold – Standard Chartered91.3440: British Pound could extend rebound against US Dollar – UOB
LIVE QUOTES

Get Started!
Sign up and access the Global Markets in less than 3 minutes

Connect With Us









Contacts
Phone: +61 2 8036 8388
Fax: +61 2 8036 8388
Email: support@tmgm.com



The information provided on this website is of a general nature only and does not constitute personal financial advice. Before acting on any information on this website, you should consider the suitability of the information in relation to your objectives, financial situation and needs. Investing in CFDs and FX Margin Contracts carries significant risks and is not suitable for all investors. You may lose more than your initial deposit. You do not own, or have, any interest in the underlying asset. We recommend that you seek independent advice and ensure you fully understand the risks involved before trading. It is important that you read and consider the disclosure document before you acquire any product listed on the website. The information and advertisements offered on this website are not intended for use by any person in any country or jurisdiction where such use would be contrary to local laws and regulations. The Products and Services offered on this website are not intended for residents of the United States, Malaysia and Thailand.
TMGM is authorized and regulated in various jurisdictions.
Trademax Australia Limited, trading as TMGM, is regulated by the Australian Securities and Investments Commission (ASIC), AFSL no. 436416 and is located at Level 28, One International Tower, 100 Barangaroo Avenue, 2000 Sydney, NSW Australia.
Email: support@tmgm.com.au
Trademax Global Limited, trading as TMGM, is authorized and regulated by the Vanuatu Financial Services Commission (VFSC), registration number 40356 and registered at 1276, Kumul Highway, Port Vila, Vanuatu, Republic of Vanuatu.
Email: support@tmgm.com
Trademax Global Markets (SE) Limited, trading as TMGM, is authorized and regulated by the Financial Services Authority (FSA) of Seychelles, with license number SD224. The company is registered at Office No 13, Providence Estate ABIS Centre, Mahe, Seychelles.
Email: support@tmgm.com
Trademax Global Markets (International) Pty Ltd, trading as TMGM, is authorized and regulated by the Financial Services Commission, Mauritius (FSC) with license no. GB22201012, and registered at 33, Edith Cavell Street C/o IQ EQ Fund Services (Mauritius) Ltd Port Louis, 11324 Mauritius.
Email: support@tmgm.com
Copyright © TMGM. All rights reserved