

Trading
Explore a wide range of markets with competitive pricing, deep liquidity, and advanced trading tools.
Learn More 
Platform
Trade seamlessly with TMGM's powerful platform, built for speed, precision, and a superior trading experience.
Learn More Trading Platform
Academy
Learn the fundamentals of trading with beginner-friendly resources, including guides, webinars, and market insights.
Learn More News & Analysis
Get real-time market updates and expert analysis to stay ahead of trading opportunities
Learn More News & Analysis
About
Learn what sets TMGM apart — our global presence, regulatory strength, and commitment to innovation in trading.
Learn More Why Choose TMGM
Sponsorship
British Pound stalls below 1.3400 despite hot UK CPI and BoE hike bets
- GBP/USD struggles below 1.3400 as geopolitical risks support the Dollar.
- UK inflation accelerates to 3.5%, driven by higher energy prices.
- November BoE hike odds reach 95% ahead of crucial Autumn Budget.
The Pound Sterling struggles to extend its gains against the US Dollar on Wednesday, even as inflation in the United Kingdom cemented the case for a Bank of England rate hike at the next meeting, while the Greenback recovers amid heightened geopolitical tensions. The GBP/USD hovers below 1.3400.
Sterling struggles as geopolitical tensions revive Dollar demand despite rising UK inflation
US economic data remains scarce on Wednesday, but market participants are getting some clues about US equities, which trade in the green, boosted by a surge in technology stocks sparked by AI hype. US Treasury yields hold firm, with the US 10-year T-note yield at 5.10%.
Geopolitics are also boosting the Greenback. Even though the news suggested a possible resolution on Tuesday, reports revealed that the Pakistani Army Chief met with Iranian officials in Tehran, where he presented a “compromise proposal,” while N12 news reported that he delivered the US a “final warning.” This means that if Iran does not agree to a peace deal, attacks would resume.
In the UK, the Consumer Price Index (CPI) rose from 3.1% to 3.5% YoY in September, according to the Office for National Statistics (ONS), primarily due to a surge in energy prices sparked by the Middle East conflict.
The data comes after the latest jobs report in the UK revealed a modest rise in wages, alongside other signs of labour market resilience.
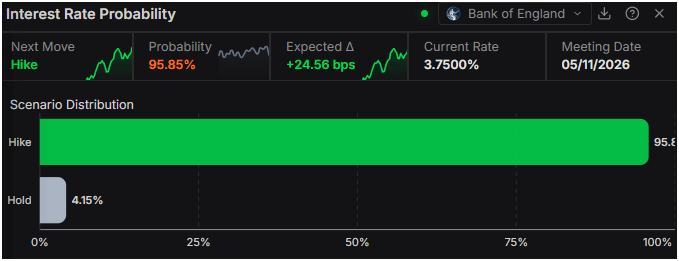
Given the backdrop, traders had priced in a 95% chance of a quarter-percentage-point rate hike by the Bank of England in the November 5 meeting.
Attention now turns to British Finance Minister John Healey's first budget, due next week. Earlier this month, Healey said his budget would bolster Britain's resilience to the Iran war’s energy-price shock and give the country "a bit of breathing space."
GBP/USD Price Forecast: Technical outlook
In the daily chart, GBP/USD trades at 1.3387, holding a bearish near-term bias as it remains capped beneath the latest triple simple moving average at 1.3409 and the downward resistance trend line break at 1.3405. The pair trades under a broader cluster of structural barriers defined by the upward support trend line breaks at 1.3620 and 1.3805, while the Relative Strength Index (14) around 57 suggests recovering but still moderate bullish momentum that has yet to overcome the overhead supply.
On the topside, initial resistance is seen at the downward resistance trend line break near 1.3405, followed closely by the triple simple moving average at 1.3409; a daily close above this band would open the way toward the next resistance zone at the upward trend line break around 1.3620, ahead of 1.3805. On the downside, the former downward resistance trend line break at 1.3271 now acts as immediate support, and a move back below this level would reinforce the broader bearish tone and expose lower levels in the coming sessions.
(The technical analysis of this story was written with the help of an AI tool. Know more.)
Pound Sterling Price Today
The table below shows the percentage change of British Pound (GBP) against listed major currencies today. British Pound was the strongest against the Euro.
| USD | EUR | GBP | JPY | CAD | AUD | NZD | CHF | |
|---|---|---|---|---|---|---|---|---|
| USD | 0.12% | -0.01% | -0.02% | 0.07% | -0.41% | -0.10% | 0.12% | |
| EUR | -0.12% | -0.22% | -0.16% | -0.09% | -0.48% | -0.27% | -0.05% | |
| GBP | 0.01% | 0.22% | 0.04% | 0.11% | -0.27% | -0.07% | 0.16% | |
| JPY | 0.02% | 0.16% | -0.04% | 0.09% | -0.29% | -0.10% | 0.13% | |
| CAD | -0.07% | 0.09% | -0.11% | -0.09% | -0.39% | -0.17% | 0.04% | |
| AUD | 0.41% | 0.48% | 0.27% | 0.29% | 0.39% | 0.22% | 0.42% | |
| NZD | 0.10% | 0.27% | 0.07% | 0.10% | 0.17% | -0.22% | 0.23% | |
| CHF | -0.12% | 0.05% | -0.16% | -0.13% | -0.04% | -0.42% | -0.23% |
The heat map shows percentage changes of major currencies against each other. The base currency is picked from the left column, while the quote currency is picked from the top row. For example, if you pick the British Pound from the left column and move along the horizontal line to the US Dollar, the percentage change displayed in the box will represent GBP (base)/USD (quote).
Top Articles
1Australian Dollar hits one-mounth high as hawkish RBA gives boost2British Pound stalls below 1.3400 despite hot UK CPI and BoE hike bets3Bitcoin vs Gold Forecast: BTC builds momentum toward $84K as XAU springs above $4,1004United Kingdom: Inflation shaped by energy shock – ING5Poland: Fiscal change and bond positioning – BNY6United States: Pre-election tail risks – Danske Bank7United States EIA Heating Oil Stocks Change above expectations (0M) in October 16: Actual (0.652M)8United States EIA Gasoline Stocks Change below expectations (0M) in October 16: Actual (-2.952M)9United States EIA Distillate Stocks Change above expectations (0M) in October 16: Actual (1.675M)
LIVE QUOTES


ALL ABOUT FOREX
Margin Call Meaning: What It Is, What Triggers It and How to Avoid One
Top 15 Weakest Currencies in the World
Top 15 Strongest Currencies in the World
Is Forex Trading Halal?
Best Time to Trade Forex
Forex Trading vs Futures Trading
Forex Trading vs Stock Trading
Forex Trading vs Crypto Trading
Is Forex Trading Profitable In 2026?
Get Started!
Sign up and access the Global Markets in less than 3 minutes

Connect With Us









Contacts
Phone: +61 2 8036 8388
Fax: +61 2 8036 8388
Email: support@tmgm.com



The information provided on this website is of a general nature only and does not constitute personal financial advice. Before acting on any information on this website, you should consider the suitability of the information in relation to your objectives, financial situation and needs. Investing in CFDs and FX Margin Contracts carries significant risks and is not suitable for all investors. You may lose more than your initial deposit. You do not own, or have, any interest in the underlying asset. We recommend that you seek independent advice and ensure you fully understand the risks involved before trading. It is important that you read and consider the disclosure document before you acquire any product listed on the website. The information and advertisements offered on this website are not intended for use by any person in any country or jurisdiction where such use would be contrary to local laws and regulations. The Products and Services offered on this website are not intended for residents of the United States, Malaysia and Thailand.
TMGM is authorized and regulated in various jurisdictions.
Trademax Australia Limited, trading as TMGM, is regulated by the Australian Securities and Investments Commission (ASIC), AFSL no. 436416 and is located at Level 28, One International Tower, 100 Barangaroo Avenue, 2000 Sydney, NSW Australia.
Email: support@tmgm.com.au
Trademax Global Limited, trading as TMGM, is authorized and regulated by the Vanuatu Financial Services Commission (VFSC), registration number 40356 and registered at 1276, Kumul Highway, Port Vila, Vanuatu, Republic of Vanuatu.
Email: support@tmgm.com
Trademax Global Markets (SE) Limited, trading as TMGM, is authorized and regulated by the Financial Services Authority (FSA) of Seychelles, with license number SD224. The company is registered at Office No 13, Providence Estate ABIS Centre, Mahe, Seychelles.
Email: support@tmgm.com
Trademax Global Markets (International) Pty Ltd, trading as TMGM, is authorized and regulated by the Financial Services Commission, Mauritius (FSC) with license no. GB22201012, and registered at 33, Edith Cavell Street C/o IQ EQ Fund Services (Mauritius) Ltd Port Louis, 11324 Mauritius.
Email: support@tmgm.com
Copyright © TMGM. All rights reserved