

Trading
Explore a wide range of markets with competitive pricing, deep liquidity, and advanced trading tools.
Learn More 
Platform
Trade seamlessly with TMGM's powerful platform, built for speed, precision, and a superior trading experience.
Learn More Trading Platform
Academy
Learn the fundamentals of trading with beginner-friendly resources, including guides, webinars, and market insights.
Learn More News & Analysis
Get real-time market updates and expert analysis to stay ahead of trading opportunities
Learn More News & Analysis
About
Learn what sets TMGM apart — our global presence, regulatory strength, and commitment to innovation in trading.
Learn More Why Choose TMGM
Sponsorship
Bitcoin Weekly Forecast: Storm not yet over
- Bitcoin slips to $61,222 on Friday, heading toward seven straight weeks of losses.
- US-listed spot ETFs are on track for a third consecutive week of billion-dollar outflows, fueling the ongoing selling pressure.
- Hawkish signals in the Federal Reserve’s FOMC minutes, rising liquidations and weakening risk appetite are leaving BTC vulnerable to further downside.
Bitcoin (BTC) extends its losing streak, dropping to $61,222 on Friday and heading toward a seventh consecutive week of losses as bearish pressure grips the broader crypto market. Persistent institutional outflows and leveraged liquidations are keeping BTC under pressure, while the hawkish tone of the Federal Reserve (Fed) leaves Crypto King vulnerable to further downside.

Heading to a third consecutive week of billion-dollar outflows
Institutional demand for Bitcoin has continued to weaken this week. SoSoValue data show BTC spot Exchange Traded Funds (ETFs) are on track for a fourth straight week of outflows, with $1.12 billion in net withdrawals through Thursday. Notably, weekly outflows are approaching a third consecutive week above the $1 billion mark, adding to persistent selling pressure on BTC and potentially pushing it into a deeper correction.
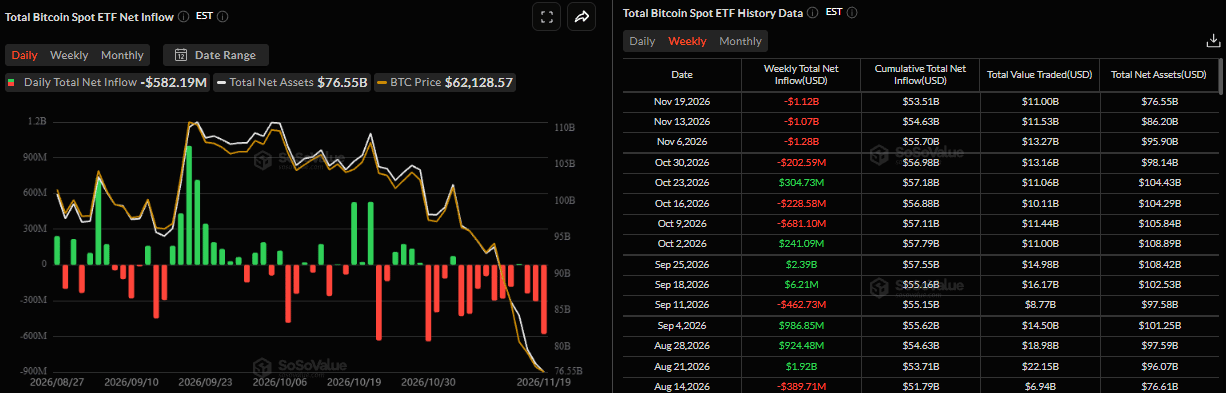
Adding to this, Bitfinex told FXStreet that investors who bought Bitcoin through ETFs in the third quarter now face substantial unrealized losses. Weighting each day’s net flow by the Bitfinex daily close gives an average entry price of around $80,070 for that period. This leaves third-quarter ETF buyers around 19% underwater. Meanwhile, the flow-weighted average entry price across the entire quarter stands at $78,300, implying an unrealized loss of approximately 17%.
“We expect Bitcoin to remain inside the July Base, between about $60,100 and $68,600, the range implied by options for the 27 November expiry, with risks still skewed towards a retest of $62,029 and the $61,300 lower edge of the Base,” the Bitfinex analyst said. “To the upside, three consecutive sessions of ETF inflows with CME OI stabilizing and STH-SOPR recovering towards 1 would indicate that institutional selling has ended and bring $69,400 and then $72,700 into view. To the downside, acceptance below $61,300 with ETF outflows above $300 million a day would point to the $57,803 cycle low,” the analyst said.
Tighter monetary stance weighs on BTC
The much-awaited minutes from the Fed’s October monetary policy meeting, released late Wednesday, came in hawkish. The meeting showed that most officials favored no rate change in October but considered additional hikes roughly acceptable based on their September estimates. Some policymakers cautioned that inflation might force them to adopt a tighter policy, with some even considering a bigger hike in December if the data worsened.
Against this macroeconomic backdrop, most participants observed that AI-related debt had grown rapidly and that much of this growth had occurred through complex, opaque financing structures. Some Fed officials were concerned that AI exposure was being concentrated in a “small number” of companies.
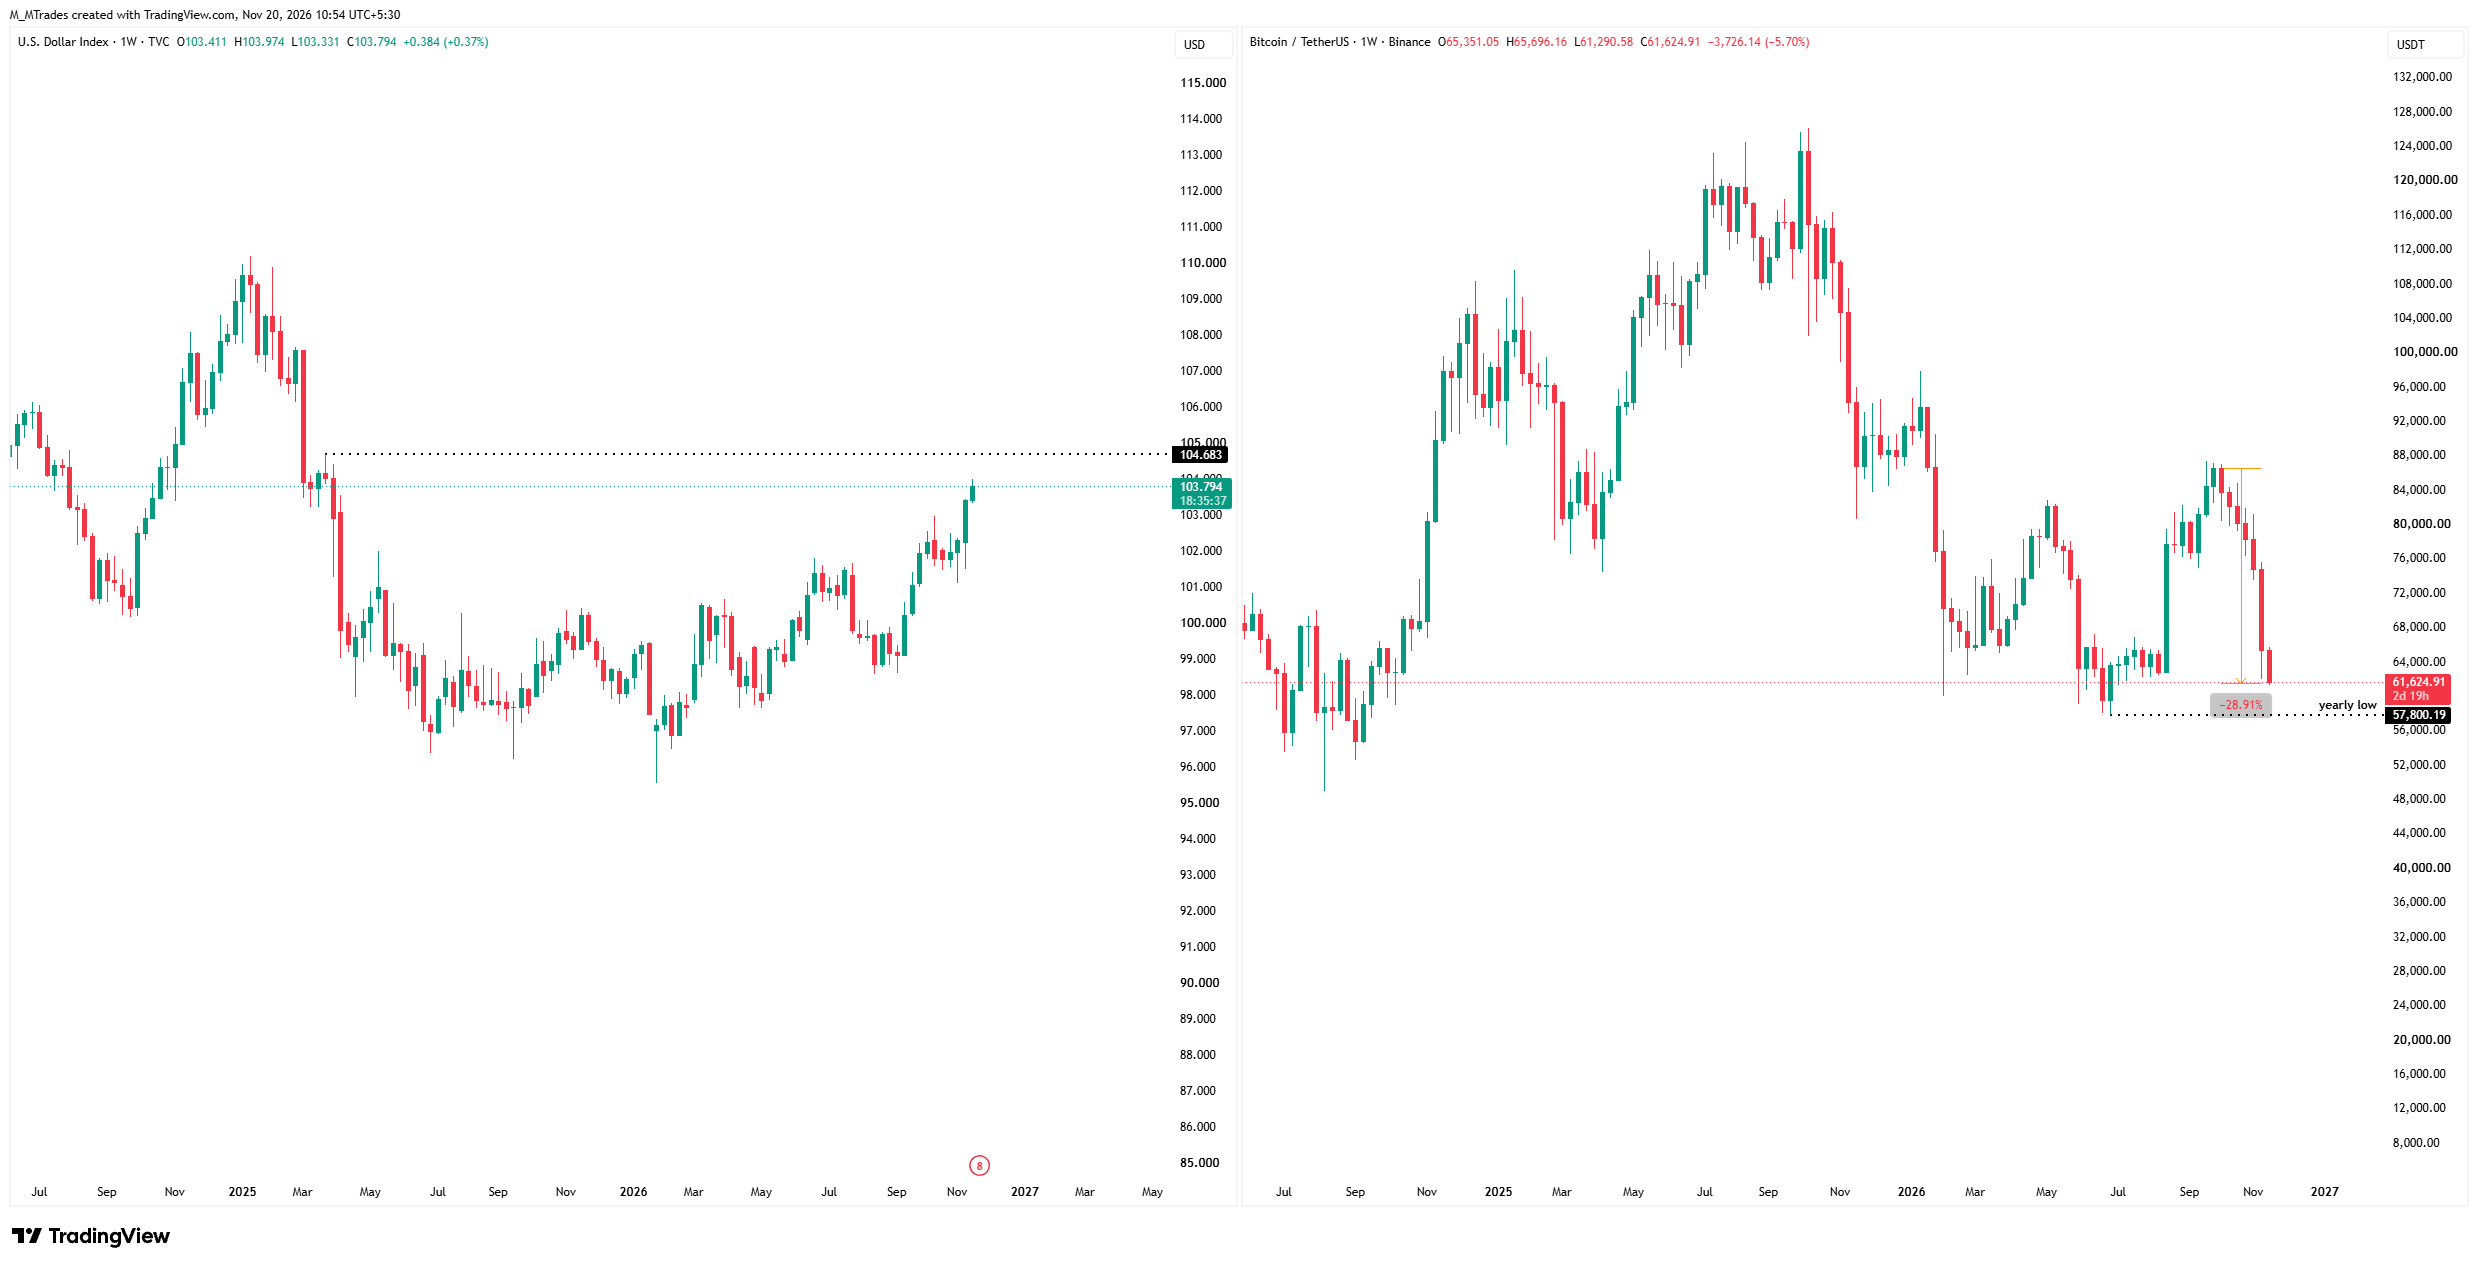
These observations weren’t a total surprise, as market participants had already been pricing in a December hike, but the minutes made the rate path look a little steeper and longer. This continues to support the US Dollar (USD) and keeps Bitcoin under pressure, with BTC sliding to a $61,222 low on Friday, levels not seen since early July.
Nvidia earnings and Anthropic IPO fail to lift risk sentiment
Technology giant Nvidia (NVDA) released its third-quarter earnings late Tuesday, reporting results that exceeded market expectations and easing some concerns surrounding the AI trade. Meanwhile, Anthropic’s record-breaking initial public offering (IPO) debut on Thursday added another key event to the week’s technology-sector narrative.
However, neither development revived broader risk appetite. The NASDAQ retreated toward its previous week’s low, while BTC extended its decline, approaching $61,222 on Friday.
In an exclusive interview, Eric He, LBank Community Angel Officer and Risk Control Advisor, told FXStreet that despite Nvidia’s strong earnings and growing anticipation around Anthropic’s IPO, investors remain reluctant to embrace risk as liquidity retreats across asset classes.
He pointed to persistent inflation, a more hawkish Fed outlook, weakening market breadth, widening credit spreads and declining commodity prices as signs of a deteriorating macroeconomic environment. Meanwhile, AI investment is increasingly facing scrutiny over the imbalance between massive infrastructure spending and monetization, while crowded AI infrastructure trades enter a period of unwinding and repricing.
For Bitcoin and the broader crypto market, the near-term outlook will largely depend on liquidity conditions and risk appetite rather than individual bullish catalysts.
“Continued tightening and capital outflows could weigh on BTC and high-beta crypto assets in the coming weeks, while any stabilization in macro conditions could trigger a sharp sentiment reversal. The next wave of outperformance may increasingly shift from crowded infrastructure narratives toward vertical AI applications with tangible commercial adoption and revenue potential,” Eric He added.
Rising liquidations
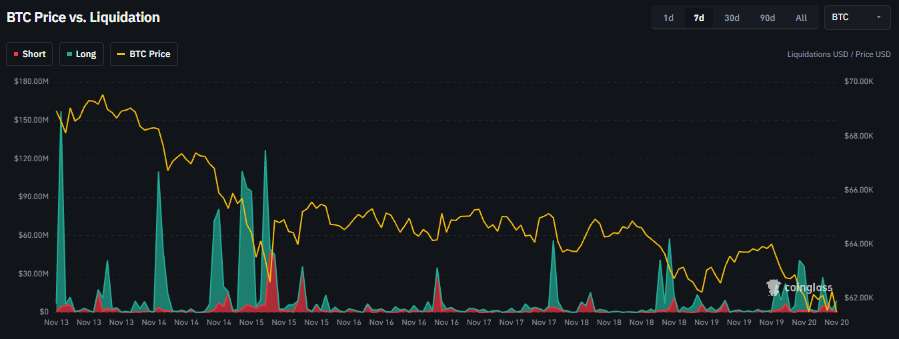
This week’s price action triggered a wave of liquidation in the crypto market. The Coinglass chart below shows that over $500 million in BTC positions were liquidated, mostly longs, highlighting bullish positioning among leveraged Bitcoin traders.
Bitcoin technical outlook: Heading toward the yearly lows
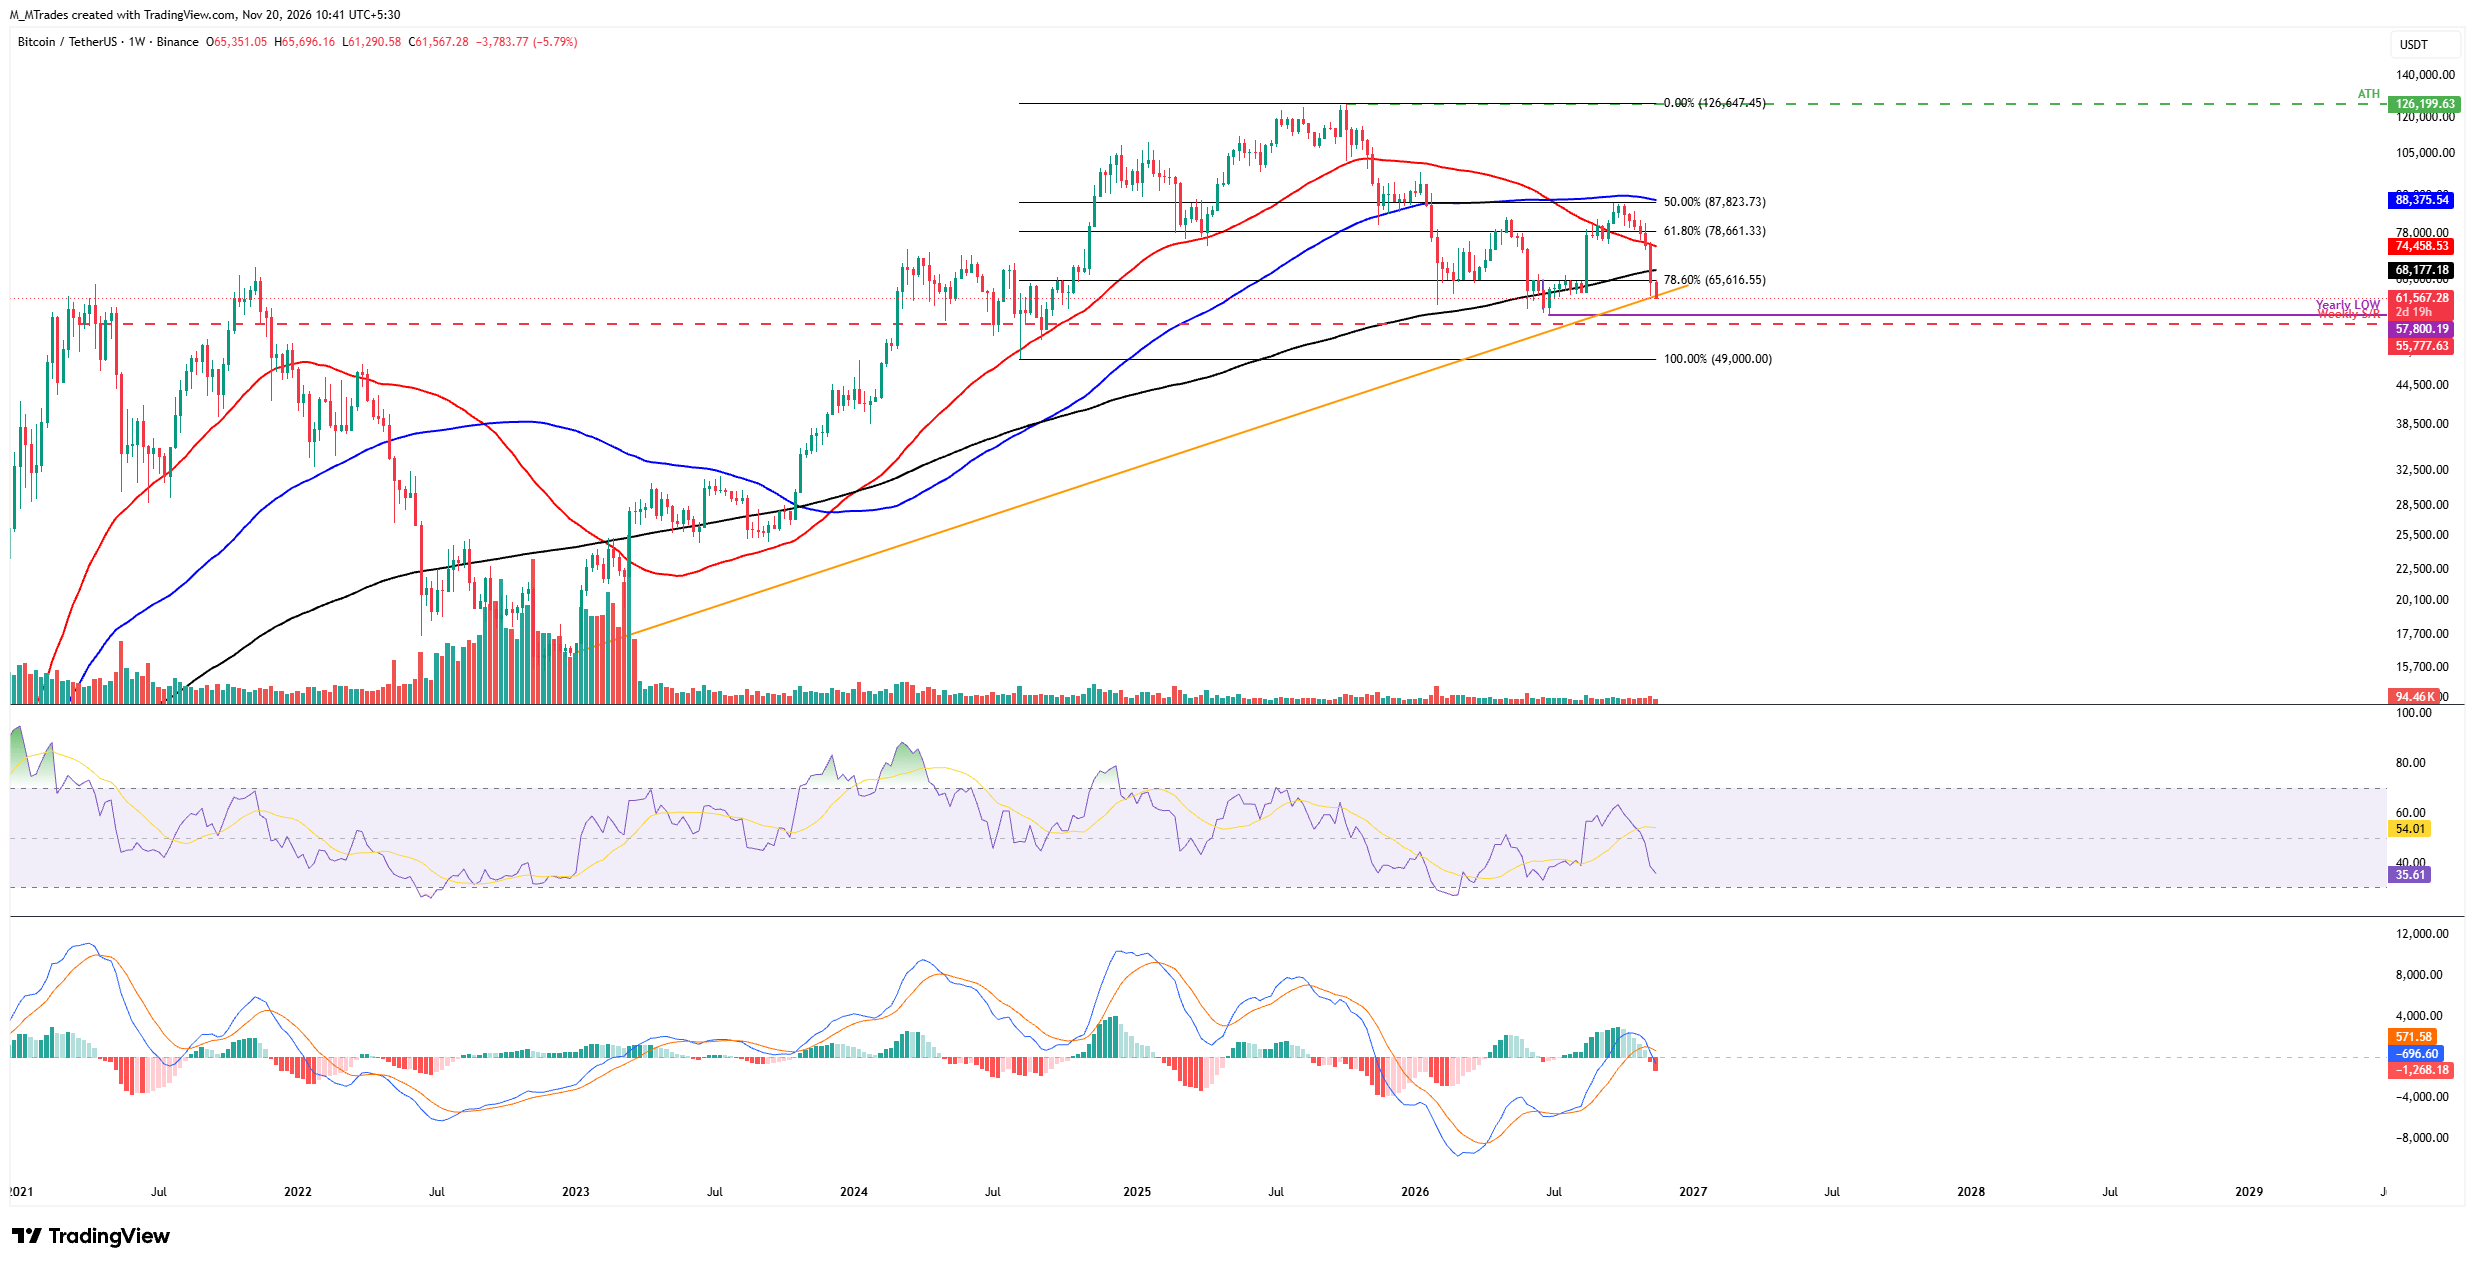
The Crypto King has been correcting since early October, posting six consecutive weeks of losses that add up to a decline of over 24%. It closed below the key 200-week Simple Moving Average (SMA) at $68,177 and the 78.6% Fibonacci retracement level of $65,616 (drawn from the August 2024 low of $49,000 to the October 2025 record high of $126,199) last week. As of this week, BTC has extended losses by more than 5%, trading around $61,567 on Friday.
If BTC continues its correction, it could signal a deeper move toward the key psychological level at $60,000. A close below this could extend losses toward the yearly low at $57,800.
The Relative Strength Index (RSI) on the weekly chart stands at 35, below the neutral 50 level, suggesting strong bearish momentum. Meanwhile, the Moving Average Convergence Divergence (MACD) showed a bearish crossover last week, which remains intact, with rising red histogram bars further supporting the bearish thesis.
On the other hand, if BTC recovers, it could extend the advance toward the 200-week SMA at $68,177.
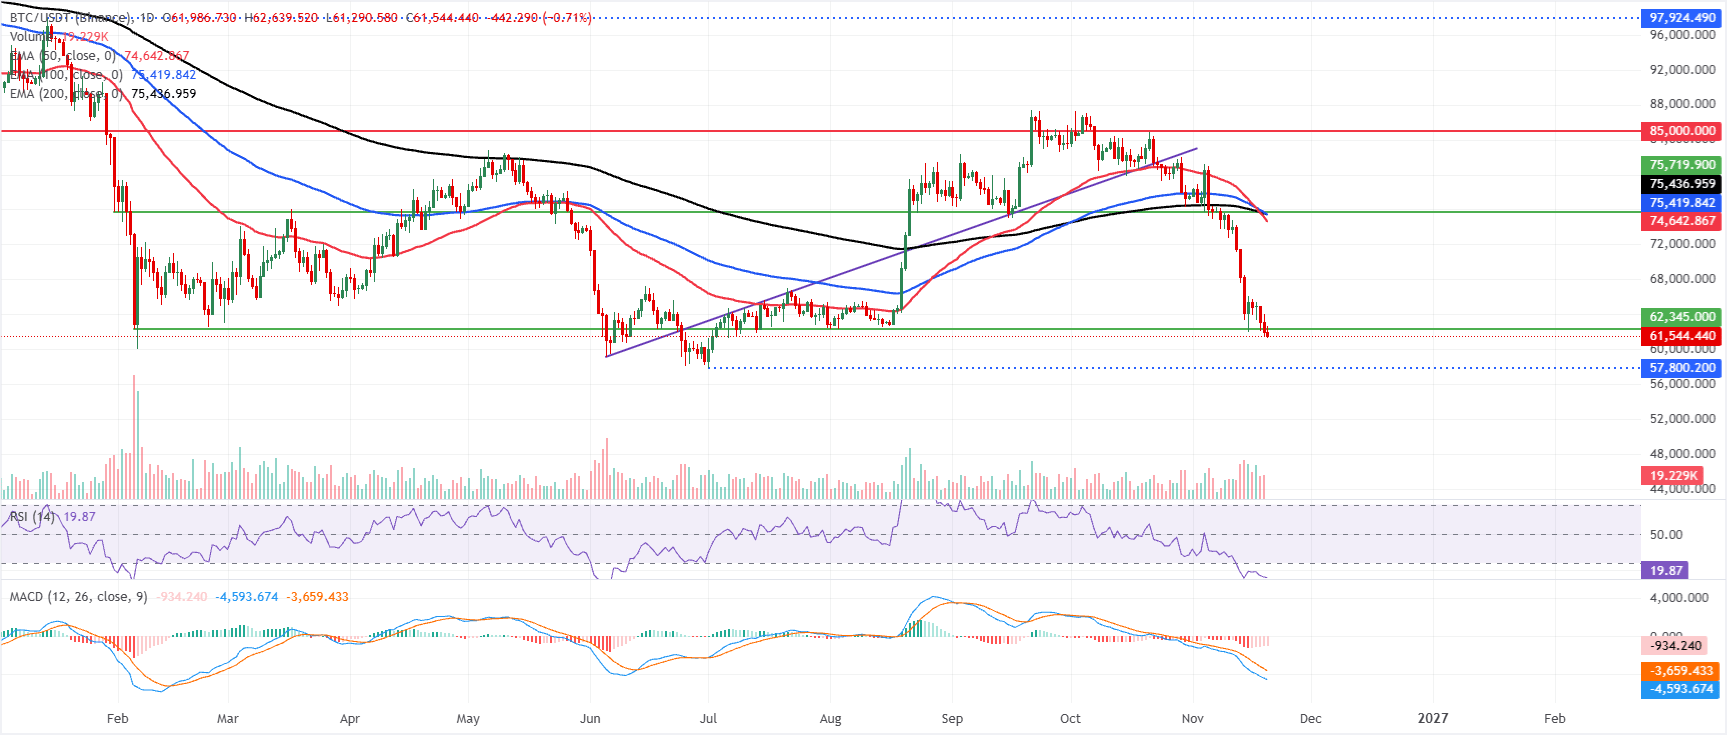
On the daily chart, BTC is extending a bearish phase as price holds well beneath the 50-day, 100-day, and 200-day Exponential Moving Averages (EMAs) clustered between roughly $74,600 and $75,400. The loss of these medium- and long-term averages keeps the broader tone pressured, while the daily RSI slipping to 19 signals deeply oversold conditions and the MACD remaining negative and subdued hints that downside momentum, though stretched, is still dominant.
On the topside, initial resistance sits at the 50-day EMA near $74,642, followed by the 100-day EMA at $75,419 and the 200-day EMA at $75,436, with a stronger medium-term cap at the horizontal barrier around $85,000. As long as BTC trades below this stacked resistance band, any rebounds are likely to be treated as corrective within the prevailing downtrend despite the risk of oversold bounces implied by momentum readings.
(The technical analysis of this story was written with the help of an AI tool. Know more.)
Bitcoin, altcoins, stablecoins FAQs
Bitcoin is the largest cryptocurrency by market capitalization, a virtual currency designed to serve as money. This form of payment cannot be controlled by any one person, group, or entity, which eliminates the need for third-party participation during financial transactions.
Altcoins are any cryptocurrency apart from Bitcoin, but some also regard Ethereum as a non-altcoin because it is from these two cryptocurrencies that forking happens. If this is true, then Litecoin is the first altcoin, forked from the Bitcoin protocol and, therefore, an “improved” version of it.
Stablecoins are cryptocurrencies designed to have a stable price, with their value backed by a reserve of the asset it represents. To achieve this, the value of any one stablecoin is pegged to a commodity or financial instrument, such as the US Dollar (USD), with its supply regulated by an algorithm or demand. The main goal of stablecoins is to provide an on/off-ramp for investors willing to trade and invest in cryptocurrencies. Stablecoins also allow investors to store value since cryptocurrencies, in general, are subject to volatility.
Bitcoin dominance is the ratio of Bitcoin's market capitalization to the total market capitalization of all cryptocurrencies combined. It provides a clear picture of Bitcoin’s interest among investors. A high BTC dominance typically happens before and during a bull run, in which investors resort to investing in relatively stable and high market capitalization cryptocurrency like Bitcoin. A drop in BTC dominance usually means that investors are moving their capital and/or profits to altcoins in a quest for higher returns, which usually triggers an explosion of altcoin rallies.
Top Articles
1LatAm FX: Real and Peso under pressure on strong Dollar – ING2Bitcoin Weekly Forecast: Storm not yet over31.3140: From a safety net to a ceiling for GBP/USD4Japanese Yen: AI risk-off could favour Yen against US Dollar – MUFG5Gold set for steepest weekly drop since March as Fed hike bets and forced selling weigh6Swiss Franc: Further weakness toward 0.8485 against US Dollar - UOB7South African Rand: Hawkish SARB overshadowed by politics and metals – Commerzbank8Ripple Price Forecast: XRP fails to reclaim $1.00 despite supply shortage on Binance9Mexican Peso: Fed hawkishness fuels weakness against US Dollar – Societe Generale


Get Started!
Sign up and access the Global Markets in less than 3 minutes

Connect With Us









Contacts
Phone: +61 2 8036 8388
Fax: +61 2 8036 8388
Email: support@tmgm.com



The information provided on this website is of a general nature only and does not constitute personal financial advice. Before acting on any information on this website, you should consider the suitability of the information in relation to your objectives, financial situation and needs. Investing in CFDs and FX Margin Contracts carries significant risks and is not suitable for all investors. You may lose more than your initial deposit. You do not own, or have, any interest in the underlying asset. We recommend that you seek independent advice and ensure you fully understand the risks involved before trading. It is important that you read and consider the disclosure document before you acquire any product listed on the website. The information and advertisements offered on this website are not intended for use by any person in any country or jurisdiction where such use would be contrary to local laws and regulations. The Products and Services offered on this website are not intended for residents of the United States, Malaysia and Thailand.
TMGM is authorized and regulated in various jurisdictions.
Trademax Australia Limited, trading as TMGM, is regulated by the Australian Securities and Investments Commission (ASIC), AFSL no. 436416 and is located at Level 28, One International Tower, 100 Barangaroo Avenue, 2000 Sydney, NSW Australia.
Email: support@tmgm.com.au
Trademax Global Limited, trading as TMGM, is authorized and regulated by the Vanuatu Financial Services Commission (VFSC), registration number 40356 and registered at 1276, Kumul Highway, Port Vila, Vanuatu, Republic of Vanuatu.
Email: support@tmgm.com
Trademax Global Markets (SE) Limited, trading as TMGM, is authorized and regulated by the Financial Services Authority (FSA) of Seychelles, with license number SD224. The company is registered at Office No 13, Providence Estate ABIS Centre, Mahe, Seychelles.
Email: support@tmgm.com
Trademax Global Markets (International) Pty Ltd, trading as TMGM, is authorized and regulated by the Financial Services Commission, Mauritius (FSC) with license no. GB22201012, and registered at 33, Edith Cavell Street C/o IQ EQ Fund Services (Mauritius) Ltd Port Louis, 11324 Mauritius.
Email: support@tmgm.com
Copyright © TMGM. All rights reserved