


Crypto Today: Bitcoin, Ethereum, XRP rise ETF capital outflows
- Bitcoin bounces off the psychological support and edges toward $64,000 amid $306 million in ETF outflows.
- Ethereum ticks up and reclaims the pivotal $1,800 level, despite persistent ETF outflows.
- XRP broadly consolidates $0.90 support and $1.00 resistance, backed by a subtle recovery in momentum indicators.
Cryptocurrency prices are gaining momentum on Thursday, albeit gradually. Bitcoin (BTC) has risen from support near $62,000, edging higher toward $64,000. Altcoins broadly mirror Bitcoin’s gains, with Ethereum (ETH) holding above $1,800 and Ripple (XRP) trading slightly higher above $0.98.
Bitcoin and Ethereum spot ETFs see outflows
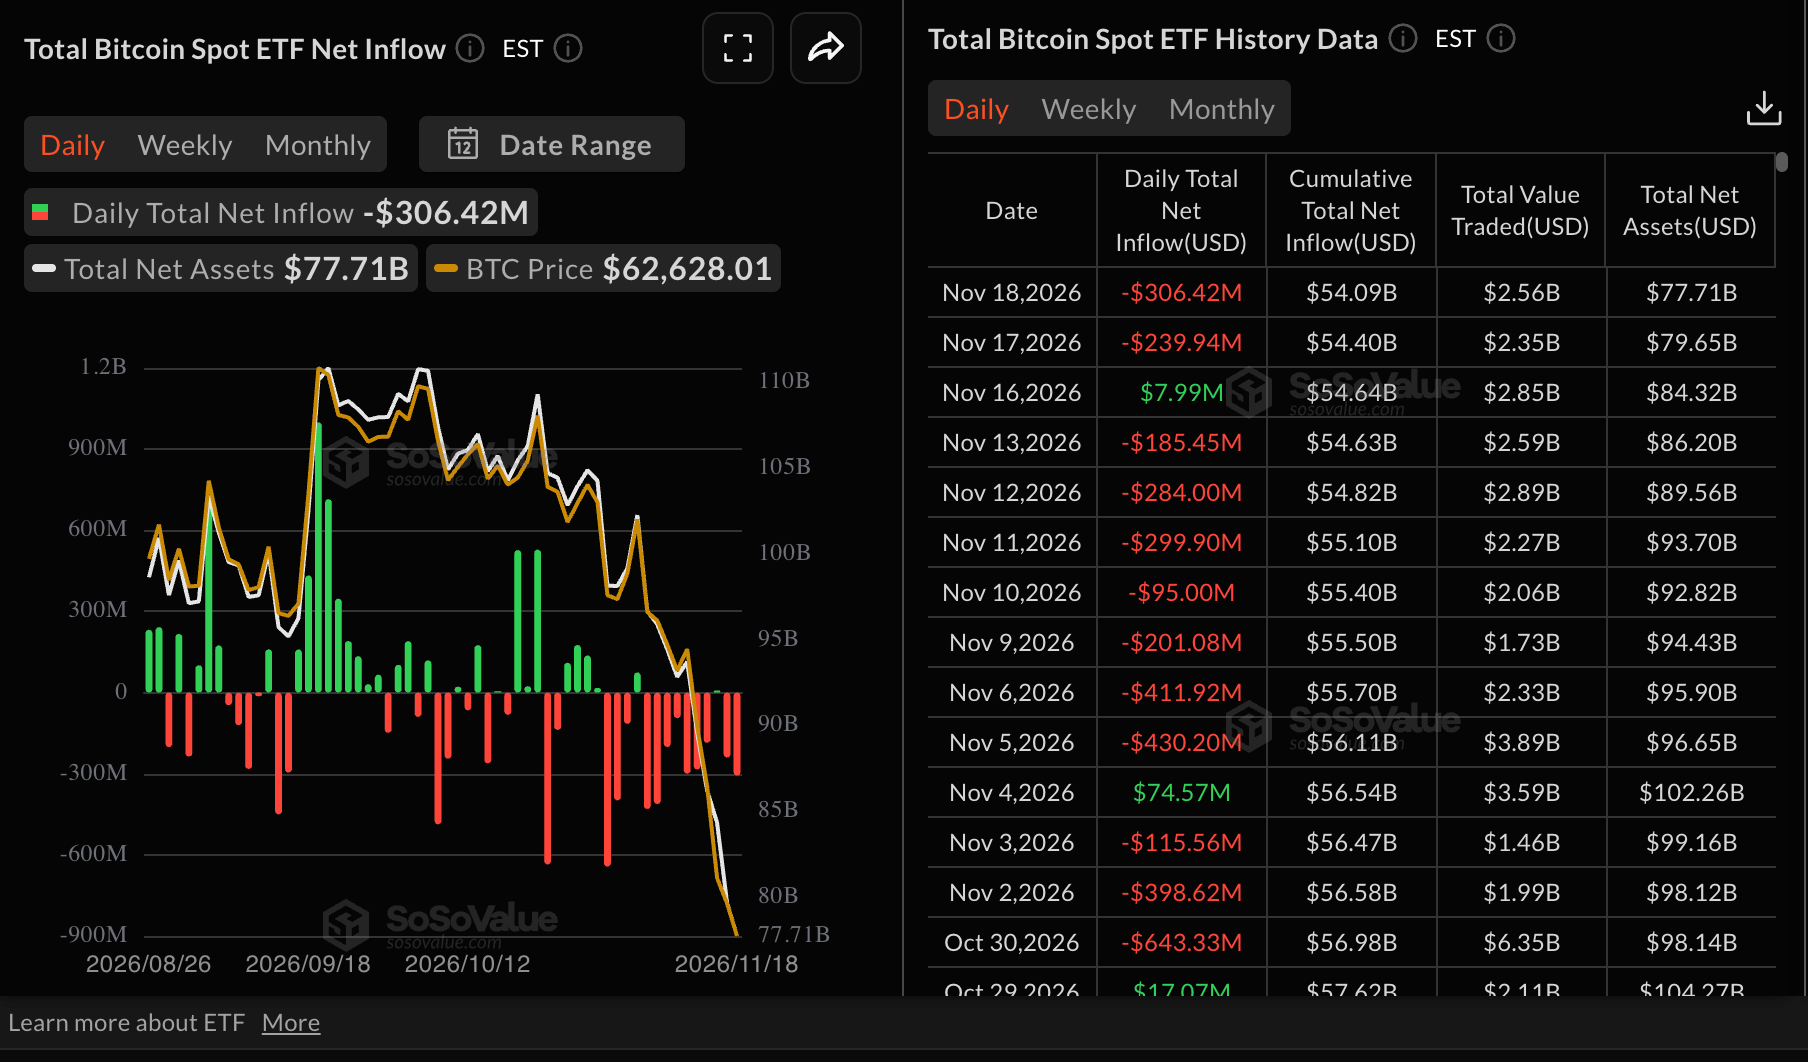
Bitcoin spot Exchange-Traded Funds (ETFs) continue to face headwinds, despite spot traders eyeing buy-the-dip opportunities. US-listed products saw $306 million in outflows on Wednesday, marking a two-day bearish streak. So far, outflows have totaled $538 million through Wednesday. Despite the notable outflows, cumulative inflows stand at $54 billion, reinforcing the institutional investors’ long-term positive outlook in the underlying asset.

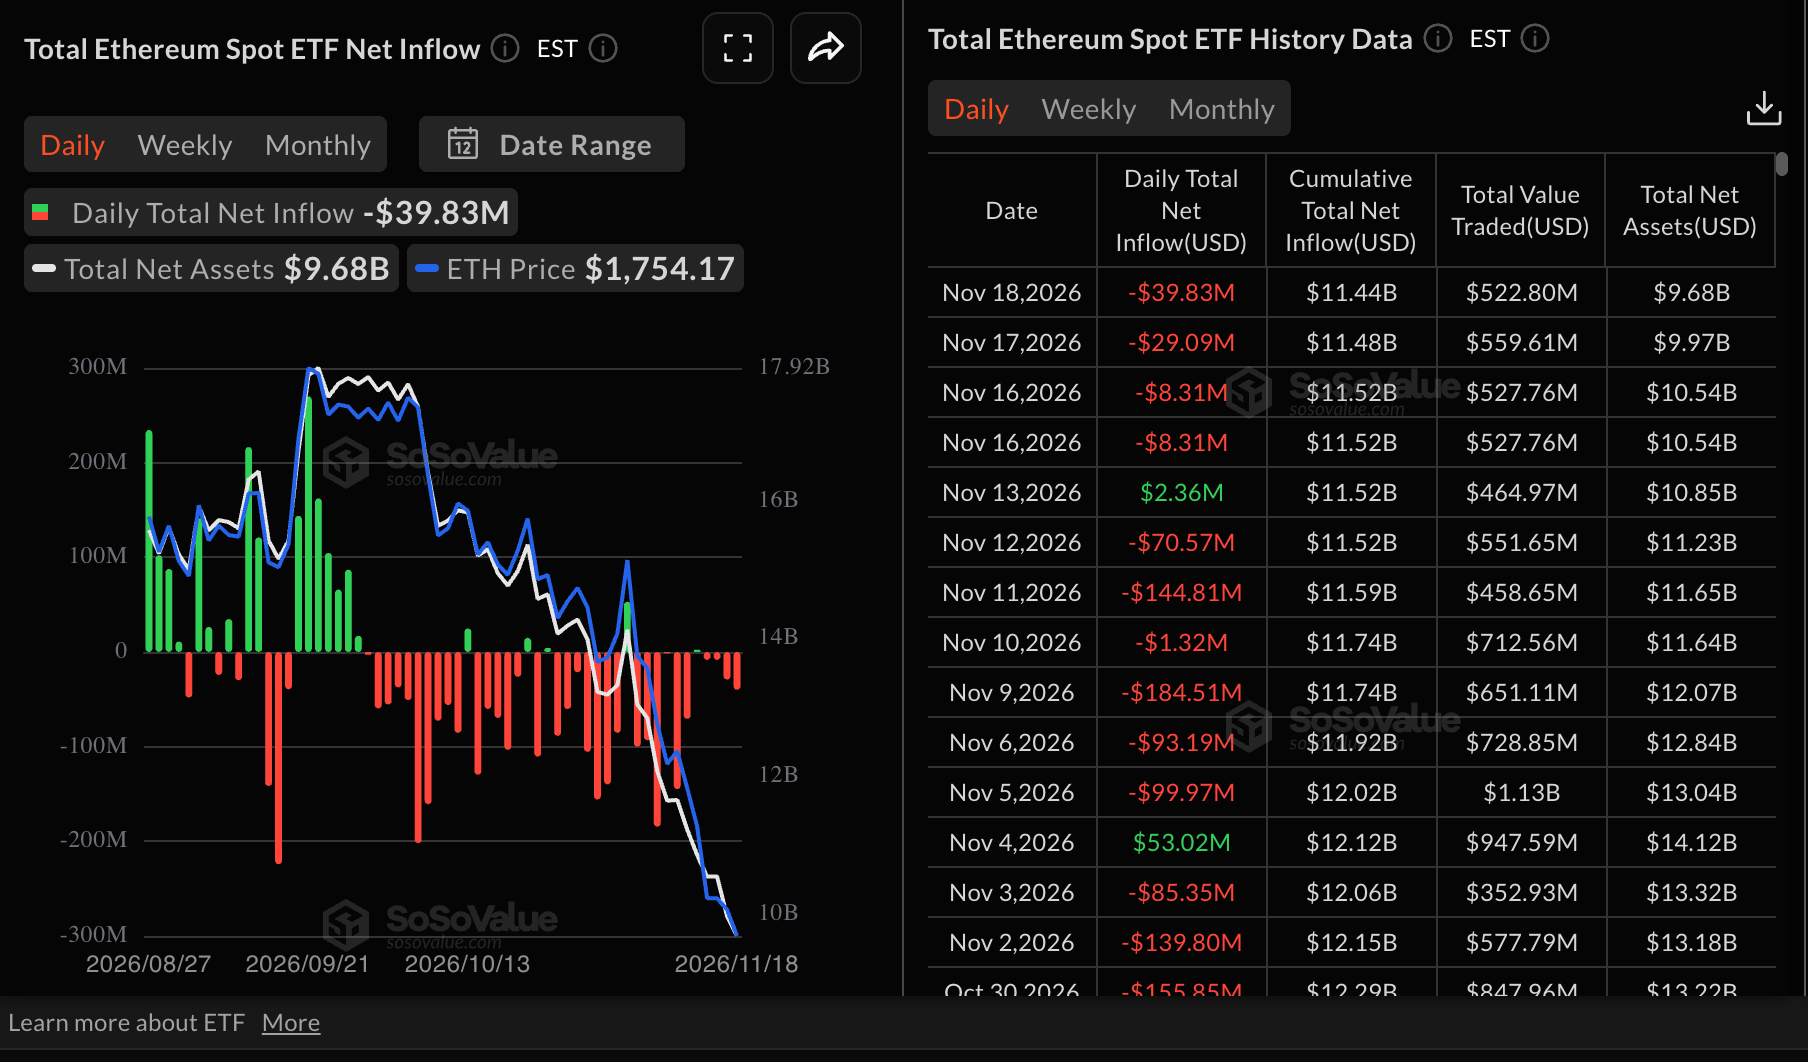
Ethereum spot ETFs similarly recorded outflows totaling $40 million on Wednesday, bringing net assets under management down to $9.7 billion. Meanwhile, cumulative inflows stand at $11.4 billion, suggesting sustained long-term interest in the asset class.
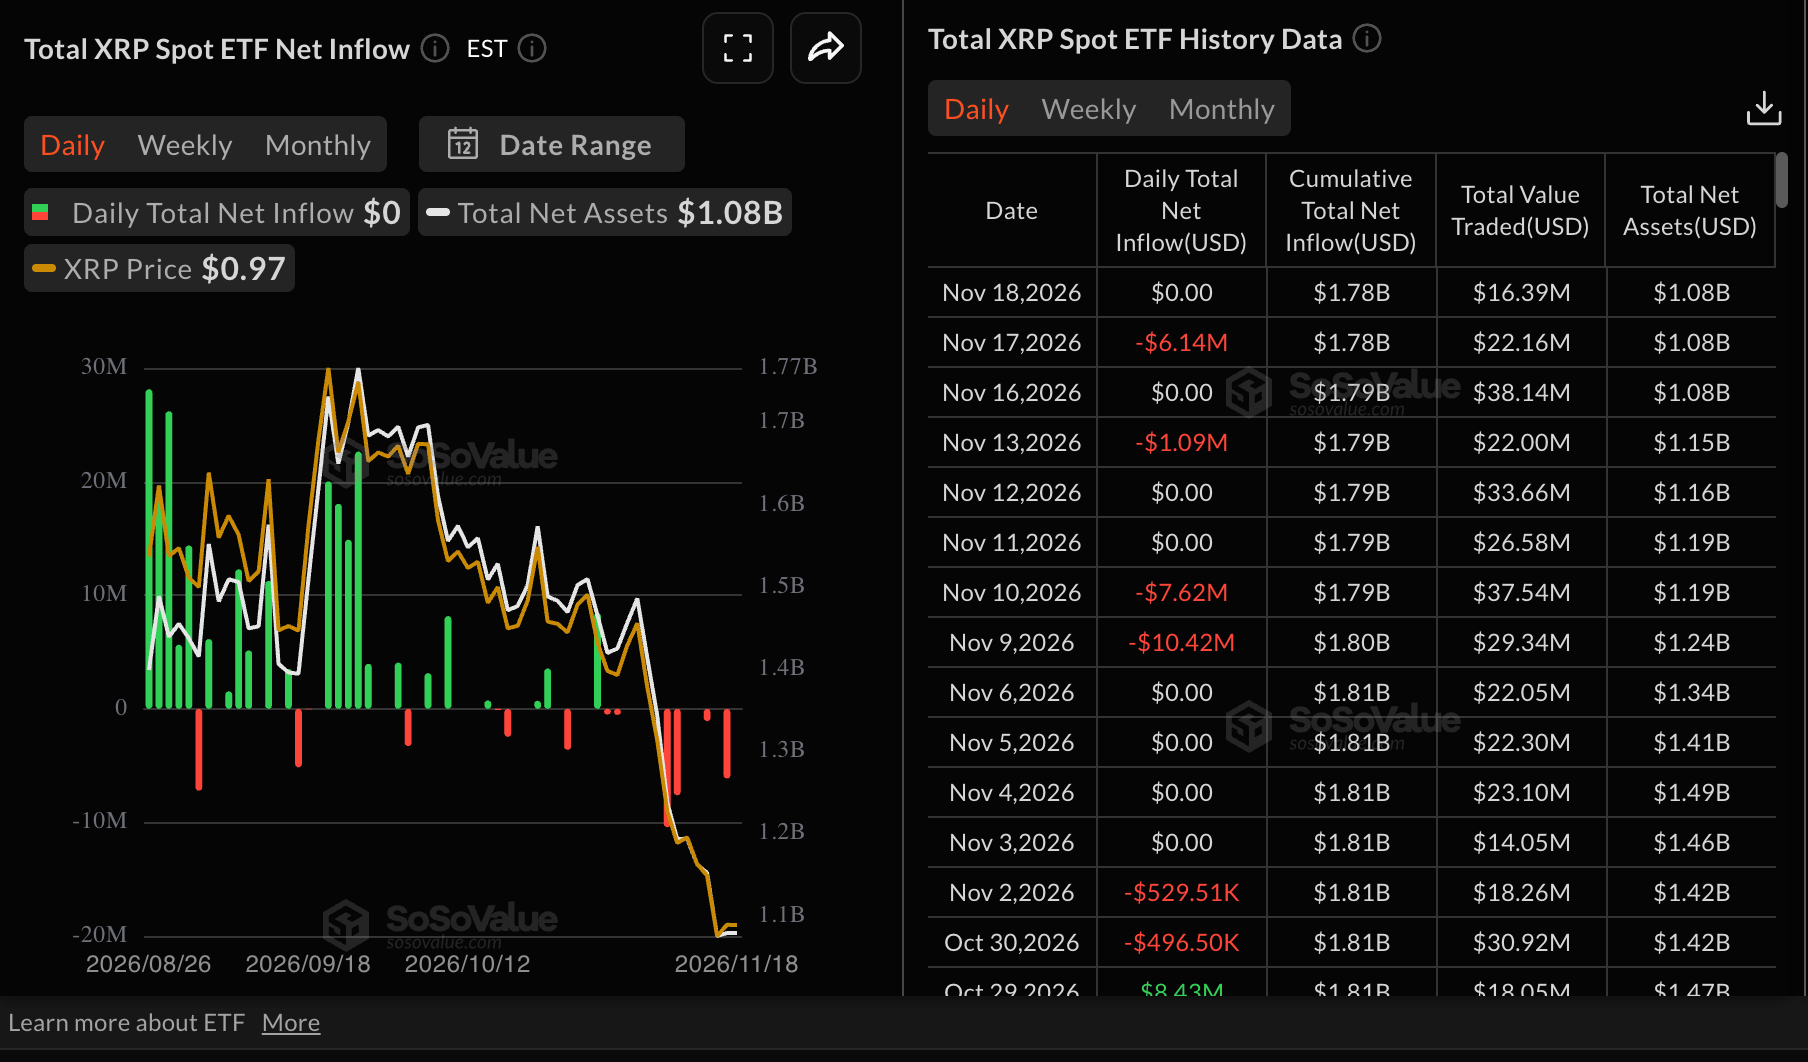
XRP spot ETFs, meanwhile, remained muted on Wednesday, with zero flows. Broadly, the outlook is bearish, given $6 million in outflows the day before and $1 million last Friday. Despite XRP spot ETFs’ first anniversary this month, cumulative inflows average $1.8 billion, with net assets under management at $1.1 billion, suggesting undersubscription compared to Bitcoin and Ethereum.
Technical analysis: Bitcoin bulls eye short-term recovery
Bitcoin trades at $63,683 as the price gradually rises. Broadly, the Crypto King is extending its slide well below the short- and long-term Exponential Moving Averages (EMAs), which keeps the near-term bias firmly bearish. The 50-day EMA at $75,244, along with the 100-day EMA at $75,733 and the 200-day EMA at $75,942, sit overhead and suggest any rebound would be corrective while price remains capped beneath this dense cluster of trend resistance.
Momentum conditions reinforce the downside tone, with the Moving Average Convergence Divergence (MACD) indicator holding in negative territory and the Relative Strength Index (RSI) around 24, signaling oversold but still pressured conditions rather than a clear base.
Immediate resistance appears first at the 50-day EMA near $75,244, followed by the 100-day EMA at $75,733 and then the 200-day EMA just under $75,943, forming a broad supply zone that bulls would need to reclaim to ease the prevailing bearish structure.
With no obvious nearby moving-average or momentum-derived supports below the current price on the daily chart, the pair remains vulnerable to further downside probes, and any recovery attempts are likely to struggle while BTC holds beneath this stacked EMA barrier on the daily chart.
Ethereum technical analysis: ETH builds momentum
Ethereum trades at $1,804, up slightly on the day. Still, the token extends a bearish phase as price holds well below the 50-day EMA at $2,209, the 100-day EMA at $2,256 and the 200-day EMA at $2,280. The tight grouping of these EMAs above spot reinforces a capped tone, suggesting that any rebound would first face structural supply around that cluster.
Momentum remains heavy, with the MACD sitting in negative territory and its latest reading deep below zero, while the RSI at 27 signals oversold conditions that could slow, but not yet reverse, the prevailing downtrend.
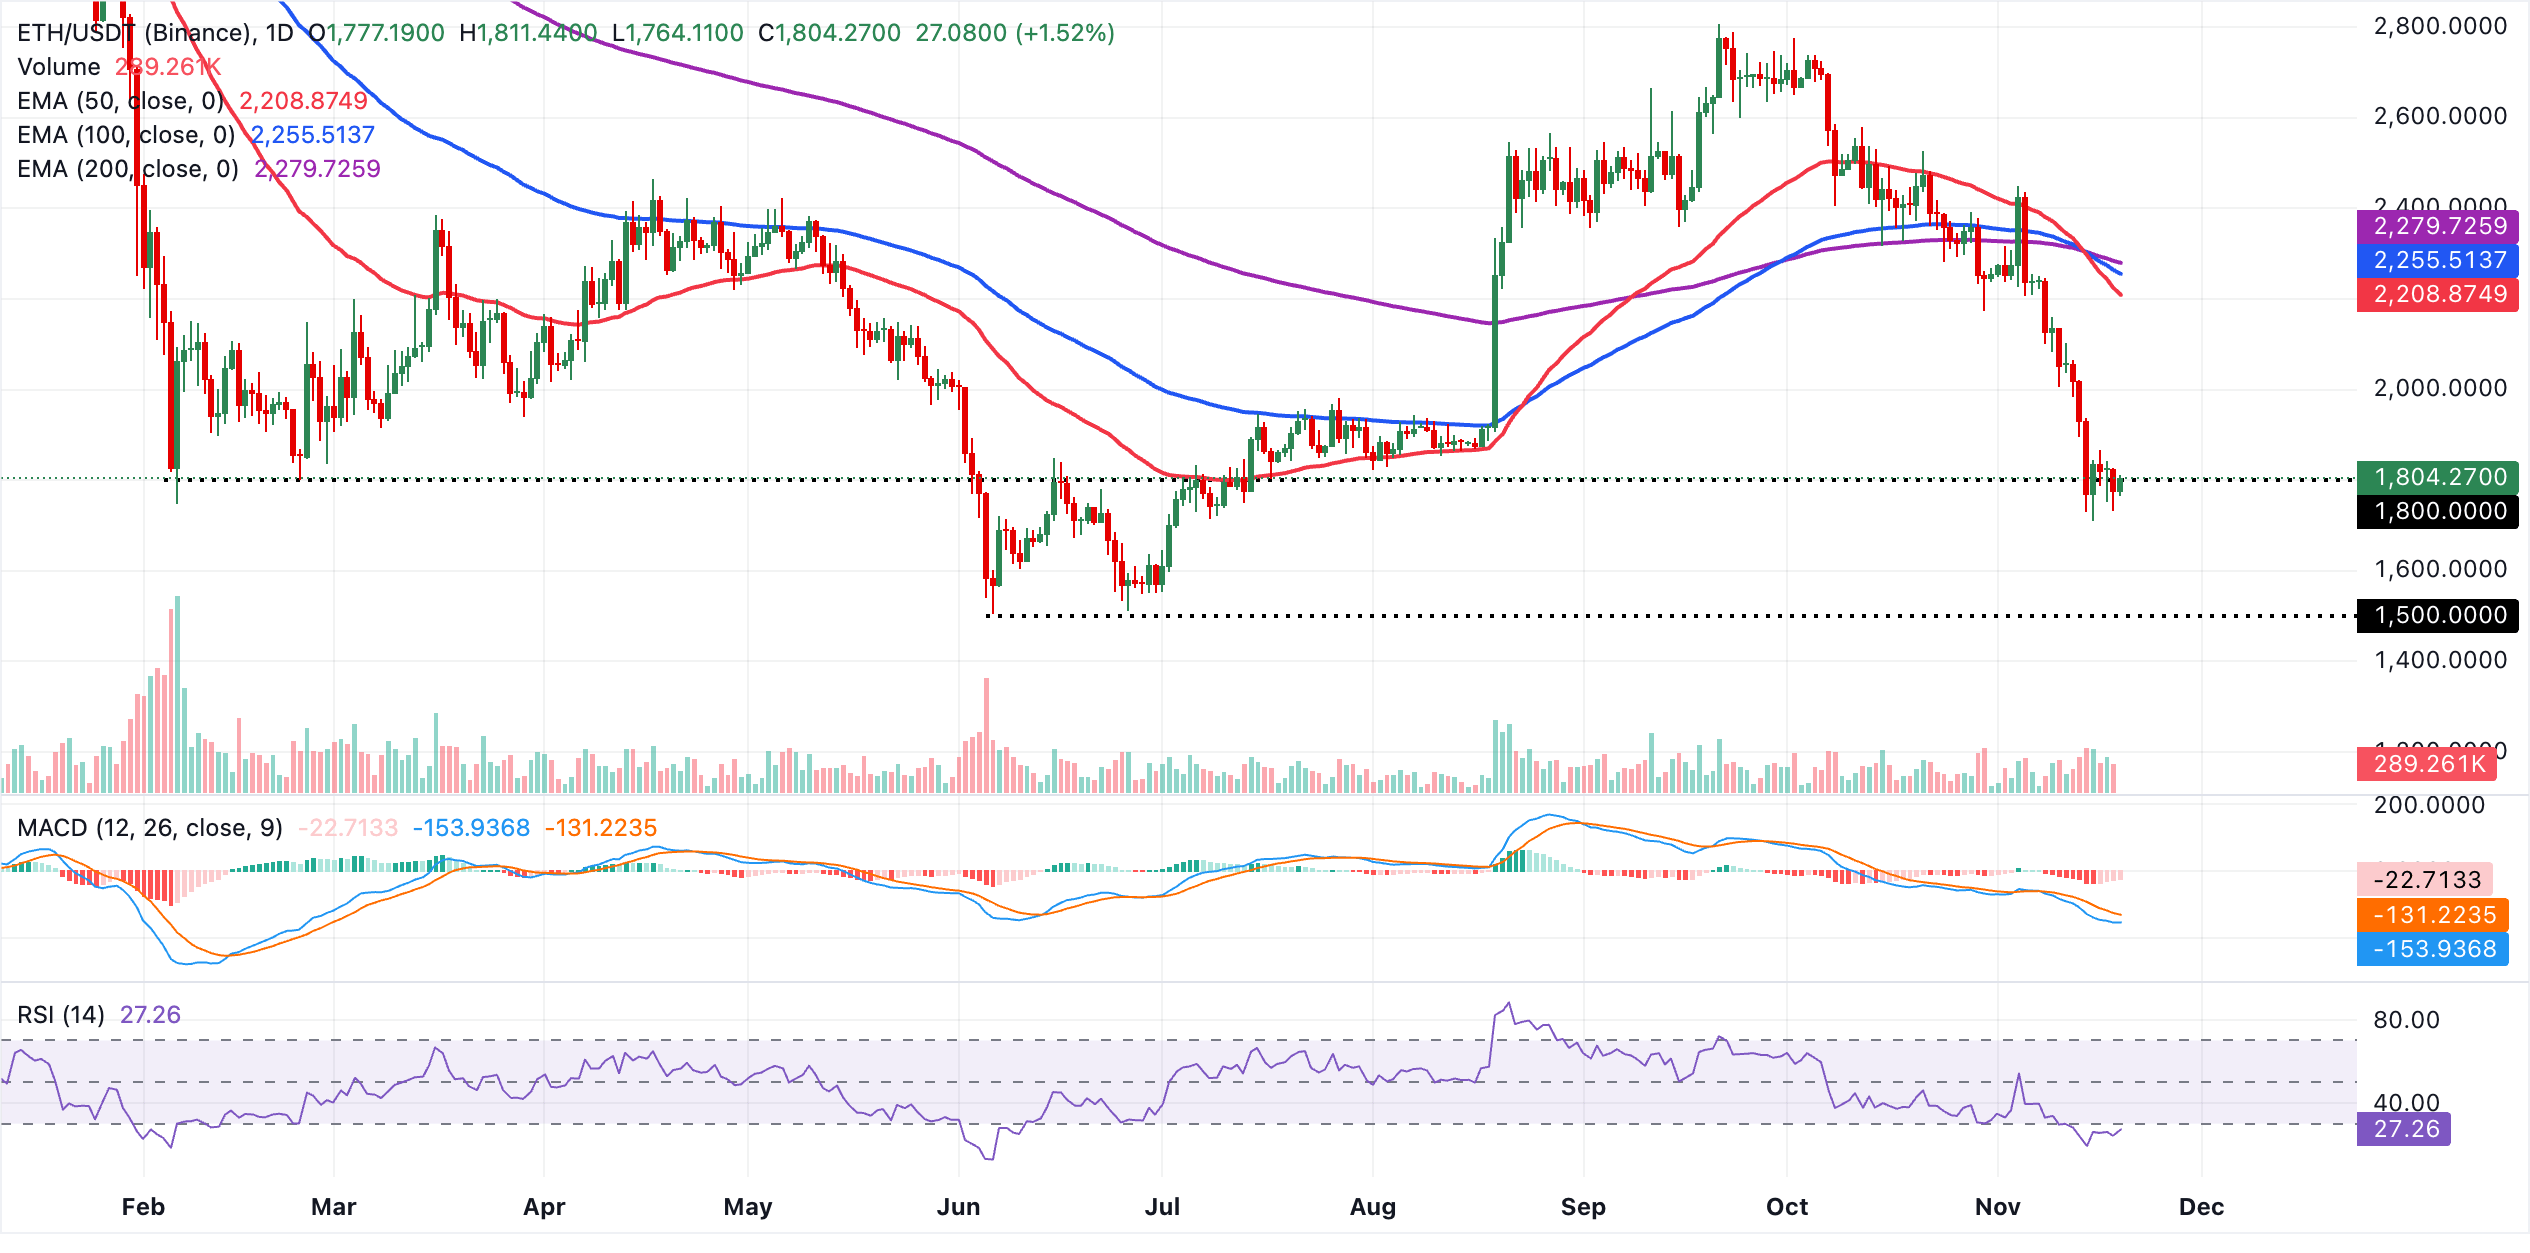
Initial resistance is at the 50-day EMA near $2,209, followed by the 100-day EMA at $2,256 and the 200-day EMA at $2,280, which together define a key recovery hurdle for bulls. On the downside, the absence of nearby moving-average or Fibonacci support in the current dataset leaves $1,800 and the recent swing lows as the next psychological reference area, with the oversold RSI hinting that further declines could slow unless the EMA cluster overhead is reclaimed decisively.
Technical analysis: XRP extends consolidation
XRP trades at $0.99, keeping a clear bearish near-term bias as price holds well below the 50-day, 100-day and 200-day EMAs at $1.20, $1.25 and $1.33 respectively. The reclaimed downward resistance trendline now projected around $1.22 reinforces the notion of a market capped by multiple overhead layers, while the RSI hovering near 32 suggests persistent but not extreme oversold conditions.
The MACD indicator remains in negative territory, with the line below its signal and a subdued histogram, hinting that downside pressure remains dominant despite the recent attempt to stabilize above $0.98.
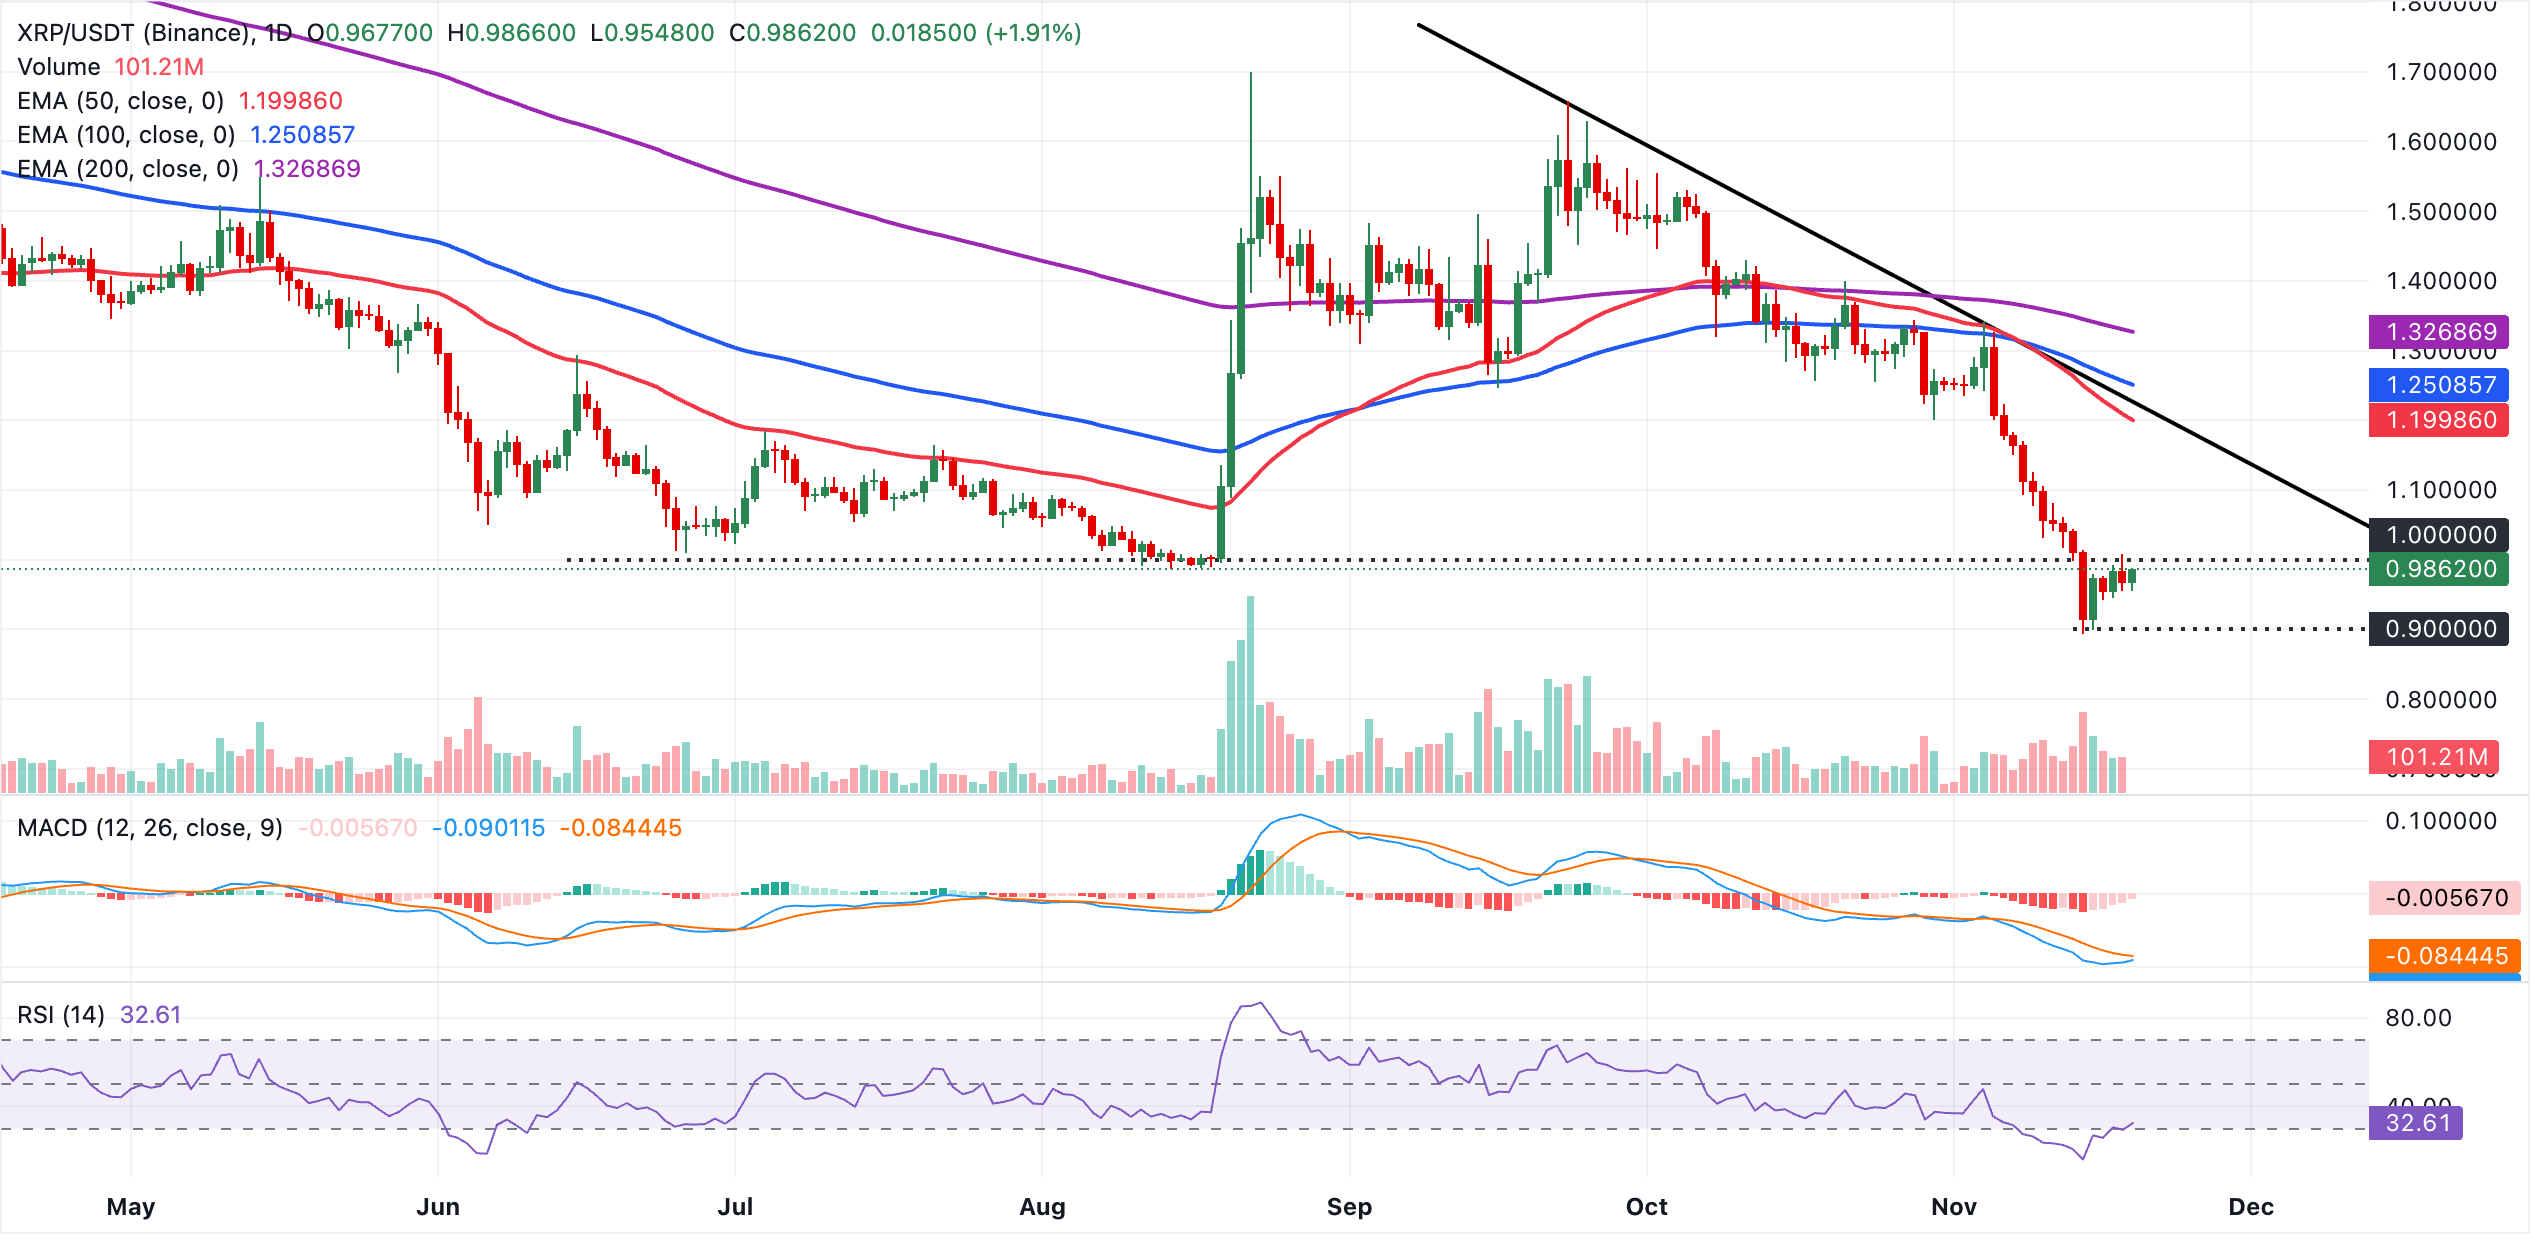
Immediate resistance is seen at the 50-day EMA near $1.20, with the broken downward trendline area around $1.22 adding to a congested supply zone slightly higher. Further up, the 100-day EMA at $1.25 marks the next barrier before the longer-term 200-day EMA at $1.33, which would need to be reclaimed to ease the broader bearish structure.
With no clear technical support defined beneath the current price on the daily chart, the pair remains vulnerable to fresh lows unless buyers can force a sustained recovery through the $1.20-$1.22 band.
(The technical analysis of this story was written with the help of an AI tool. Know more.)
Crypto ETF FAQs
An Exchange-Traded Fund (ETF) is an investment vehicle or an index that tracks the price of an underlying asset. ETFs can not only track a single asset, but a group of assets and sectors. For example, a Bitcoin ETF tracks Bitcoin’s price. ETF is a tool used by investors to gain exposure to a certain asset.
Yes. The first Bitcoin futures ETF in the US was approved by the US Securities & Exchange Commission in October 2021. A total of seven Bitcoin futures ETFs have been approved, with more than 20 still waiting for the regulator’s permission. The SEC says that the cryptocurrency industry is new and subject to manipulation, which is why it has been delaying crypto-related futures ETFs for the last few years.
Yes. The SEC approved in January 2024 the listing and trading of several Bitcoin spot Exchange-Traded Funds, opening the door to institutional capital and mainstream investors to trade the main crypto currency. The decision was hailed by the industry as a game changer.
The main advantage of crypto ETFs is the possibility of gaining exposure to a cryptocurrency without ownership, reducing the risk and cost of holding the asset. Other pros are a lower learning curve and higher security for investors since ETFs take charge of securing the underlying asset holdings. As for the main drawbacks, the main one is that as an investor you can’t have direct ownership of the asset, or, as they say in crypto, “not your keys, not your coins.” Other disadvantages are higher costs associated with holding crypto since ETFs charge fees for active management. Finally, even though investing in ETFs reduces the risk of holding an asset, price swings in the underlying cryptocurrency are likely to be reflected in the investment vehicle too.















本网站提供的信息仅具有一般性质,不构成个人财务建议。在根据本网站上的任何信息采取行动之前,您应结合自身的目标、财务状况和需求,考虑该信息是否适合您。投资差价合约(CFD)和外汇保证金合约具有重大风险,并不适合所有投资者。您的亏损可能超过初始入金。您并不拥有,也不享有任何相关标的资产的权益。我们建议您寻求独立意见,并在交易前确保您已充分了解所涉及的风险。在购买本网站列出的任何产品之前,务必阅读并考虑相关披露文件。本网站提供的信息和广告并非面向任何在其所在国家或司法管辖区使用此类信息会违反当地法律法规的人士。本网站提供的产品和服务不面向美国、马来西亚和泰国居民。
TMGM 是由多家金融监管机构授权。
TMGM 集团下的 Trademax Australia Limited 公司(交易名称为TMGM),是由澳大利亚证券和投资委员(ASIC)监管的金融服务公司,金融服务牌照号为 436416,公司地址为 Level 28, One International Tower, 100 Barangaroo Avenue, 2000 Sydney, NSW Australia.
邮箱:support@tmgm.com.au
TMGM 集团下的 Trademax Global Limited公司(交易名称为TMGM),是由瓦努阿图金融服务委员会(VFSC)监管的金融服务公司,金融牌照号为 40356,注册地址为 1276, Kumul Highway, Port Vila, Vanuatu, Republic of Vanuatu.
邮箱:support@tmgm.com
Trademax Global Markets (SE) Limited,以 TMGM 名义经营,获塞舌尔金融服务管理局(FSA)授权并监管,许可证号为 SD224。公司注册地址为塞舌尔马埃岛 Providence Estate ABIS 中心13号办公室。
邮箱:support@tmgm.com
TMGM集团下的Trademax Global Markets (International) Pty Ltd公司(交易名称为TMGM),是由毛里求斯金融服务委员会监管的金融服务公司. 牌照号为 GB22201012,注册地址为33, Edith Cavell Street C/o IQ EQ Fund Services (Mauritius) Ltd Port Louis, 11324 Mauritius.
邮箱:support@tmgm.com
版权所有 © TMGM。保留所有权利