

NZD/USD Price Forecast: Bears lean on 0.5700 as RSI sinks
- NZD/USD extends two-day slide after hawkish Fed signals.
- RSI nears oversold territory as sellers pressure 0.5700 support.
- Break below 0.5700 exposes 0.5671, 0.5650 and 0.5626.
The New Zealand Dollar extends its losses for the second straight trading session, down 0.13% after last week’s Fed rate hike and a hawkish tilt within the board, which was reinforced by speeches of Fed officials on Monday. The NZD/USD trades at 0.5717.
NZD/USD Price Forecast: Technical Outlook
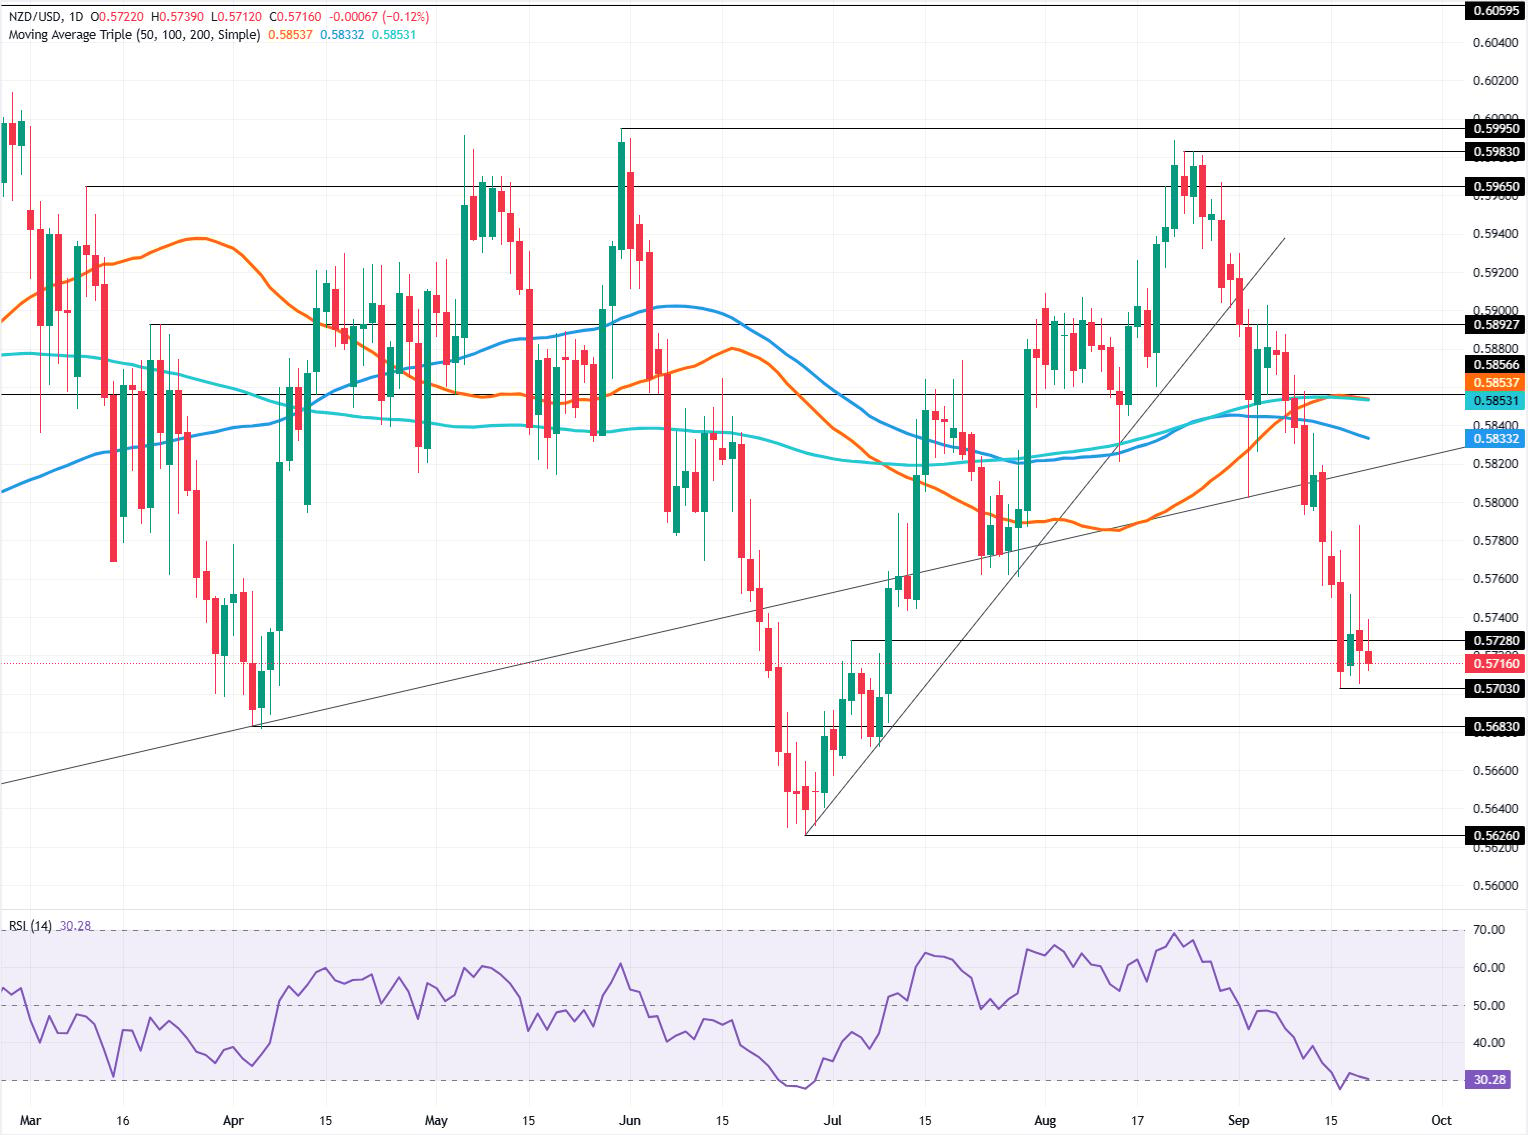
The market's structure shows the NZD/USD remains in consolidation, with the pair trading near a two-month low spotted on September 16 at 0.5703, for the fourth straight session. Momentum, as measured by the Relative Strength Index (RSI), shows that sellers are gaining steam, with the index being bearish and about to turn oversold.

If NZD/USD dives below 0.5700, a potential move to the July 8 low of 0.5671 is on the cards. Below, the next area of interest is 0.5650, followed by the June 26 low of 0.5626. If hurdled, 0.5600 is up next.
On the upside, if Kiwi buyers clear the September 18 high of 0.5787, a move to 0.5800 is on the cards. If hurdled, the pair would gain some strength but face key resistance levels at the 100-day Simple Moving Average (SMA) at 0.5833, followed by the confluence of the 200- and 50-day SMA at 0.5853.
NZD/USD Price Chart – Daily
New Zealand Dollar Price Today
The table below shows the percentage change of New Zealand Dollar (NZD) against listed major currencies today. New Zealand Dollar was the strongest against the Canadian Dollar.
| USD | EUR | GBP | JPY | CAD | AUD | NZD | CHF | |
|---|---|---|---|---|---|---|---|---|
| USD | 0.13% | 0.18% | 0.27% | 0.33% | 0.06% | 0.12% | -0.18% | |
| EUR | -0.13% | -0.01% | 0.09% | 0.16% | -0.12% | -0.09% | -0.36% | |
| GBP | -0.18% | 0.00% | 0.08% | 0.15% | -0.10% | -0.10% | -0.34% | |
| JPY | -0.27% | -0.09% | -0.08% | 0.06% | -0.25% | -0.14% | -0.40% | |
| CAD | -0.33% | -0.16% | -0.15% | -0.06% | -0.29% | -0.22% | -0.49% | |
| AUD | -0.06% | 0.12% | 0.10% | 0.25% | 0.29% | 0.06% | -0.22% | |
| NZD | -0.12% | 0.09% | 0.10% | 0.14% | 0.22% | -0.06% | -0.27% | |
| CHF | 0.18% | 0.36% | 0.34% | 0.40% | 0.49% | 0.22% | 0.27% |
The heat map shows percentage changes of major currencies against each other. The base currency is picked from the left column, while the quote currency is picked from the top row. For example, if you pick the New Zealand Dollar from the left column and move along the horizontal line to the US Dollar, the percentage change displayed in the box will represent NZD (base)/USD (quote).














