

การเทรด
สำรวจตลาดที่หลากหลายด้วยราคาที่แข่งขันได้ สภาพคล่องสูง และเครื่องมือการเทรดขั้นสูง
เรียนรู้เพิ่มเติม 
แพลตฟอร์ม
เทรดอย่างไร้รอยต่อกับแพลตฟอร์มอันทรงพลังของ TMGM ที่สร้างขึ้นเพื่อความรวดเร็ว แม่นยำ และประสบการณ์การเทรดที่เหนือกว่า
เรียนรู้เพิ่มเติม แพลตฟอร์มการเทรด
เครื่องมือการเทรด
สถาบัน
เรียนรู้พื้นฐานการเทรดด้วยแหล่งข้อมูลสำหรับผู้เริ่มต้น รวมถึงคู่มือ สัมมนาออนไลน์ และข้อมูลเชิงลึกตลาด
เรียนรู้เพิ่มเติม ข่าว & วิเคราะห์
รับข้อมูลอัปเดตตลาดแบบเรียลไทม์และบทวิเคราะห์จากผู้เชี่ยวชาญเพื่อคว้าโอกาสการเทรดก่อนใคร
เรียนรู้เพิ่มเติม ข่าว & วิเคราะห์
เกี่ยวกับ
เรียนรู้สิ่งที่ทำให้ TMGM โดดเด่น — การดำเนินงานทั่วโลก ความแข็งแกร่งด้านการกำกับดูแล และความมุ่งมั่นสู่การสร้างสรรค์นวัตกรรมในการเทรด
เรียนรู้เพิ่มเติม ทำไมต้องเลือก TMGM
Silver Price Forecast: XAG/USD tests the $55 floor as sellers retain control
- Silver extends its decline as the US Dollar rebounds and Treasury yields stabilize.
- Higher Oil prices keep inflation risks and expectations of a Fed rate hike later this year alive.
- XAG/USD trades near the $55 floor, with the technical outlook tilted firmly to the downside.
Silver (XAG/USD) extends its decline on Thursday as the US Dollar (USD) rebounds and US Treasury yields stabilize following a two-day drop driven by softer-than-expected US inflation data. At the time of writing, XAG/USD trades around $55.75, down 3.50% on the day.

Despite the softer inflation readings, price pressures could pick up again as escalating tensions in the Middle East drive Oil prices higher. This keeps the possibility of a Federal Reserve (Fed) interest rate hike later this year alive, supporting the US Dollar and weighing on the non-yielding metal, which typically performs better in a low-interest-rate environment.
XAG/USD remains in a corrective phase. The latest leg lower has brought prices back to the December 2025 lows, a level that was also tested in June.
The metal is now trading more than 50% below its record high of $121 reached in January and remains vulnerable to further losses unless Fed rate hike expectations fade, which appears unlikely in the near term.
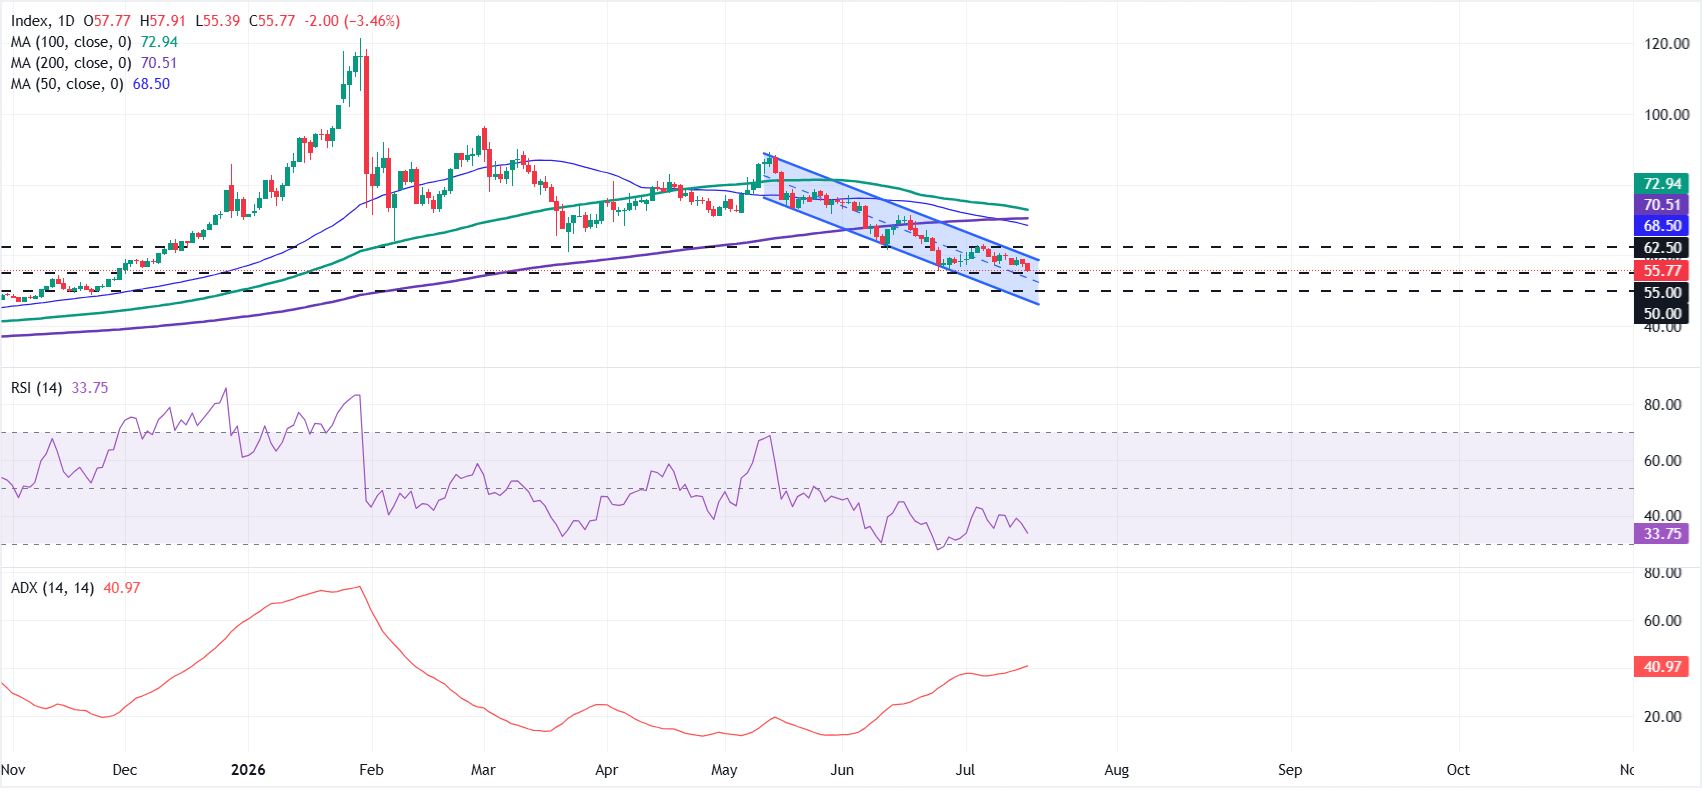
From a technical perspective, XAG/USD extends its decline within a well-defined descending parallel channel and trades below the 50-day, 100-day and 200-day Simple Moving Averages (SMAs), reinforcing the bearish outlook.
The Relative Strength Index (RSI) on the daily chart is near 34 and the Average Directional Index around 41, suggesting a strong but still downside-skewed trend as price consolidates only slightly above the $55 structural floor.
On the upside, initial resistance emerges at the upper boundary of the descending channel near $60, followed by the horizontal barrier at $62.50 before the clustered 50- and 200-day SMAs around $68.50-70.51, and the more distant 100-day SMA at $72.94.
On the downside, immediate support lies at $55.00, followed by the psychological $50 mark and the lower boundary of the channel near $45.50. These levels could slow the decline, but sellers retain control while XAG/USD trades below its major moving averages.
บทความยอดนิยม
1ฟิวเจอร์ส Dow Jones ปรับตัวขึ้น หลังผลประกอบการ Nvidia หนุนความเชื่อมั่นต่อ AI ก่อน Anthropic เสนอขายหุ้น IPO2ราคาน้ำมันดิบ WTI ค่อย ๆ อ่อนตัวลงต่ำกว่า 83.00 ดอลลาร์ หลังสต็อกน้ำมันสหรัฐฯ เพิ่มขึ้นช่วยคลายความกังวลด้านอุปทาน3เยนญี่ปุ่น: ซื้อขายในกรอบ 158.60–160.15 เมื่อเทียบกับดอลลาร์สหรัฐ – UOB4ธนาคารกลางอังกฤษ: คาดว่าเงินเฟ้อจะปรับตัวสูงขึ้นอีกภายในกลางปีหน้า5ดอลลาร์นิวซีแลนด์อ่อนค่า ขณะดอลลาร์สหรัฐแข็งค่าก่อนการเปิดเผยรายงานการประชุม FOMC6คาดการณ์ราคาโลหะเงิน: XAG/USD แตะระดับต่ำสุดใหม่ของปีใกล้ $45.60 ขณะดอลลาร์สหรัฐแข็งค่าต่อเนื่อง7ดอลลาร์สหรัฐ: แรงหนุนจากเฟดก่อนพลิกทิศในช่วงครึ่งหลังปี 2027 - OCBC8คาดการณ์ดัชนีดอลลาร์สหรัฐ: DXY อาจมุ่งสู่ระดับ 104.00 ขณะที่ฝั่งขาขึ้นรอรายงานการประชุม FOMC9รูเปียห์อินโดนีเซียแข็งค่า หลังธนาคารกลางอินโดนีเซียปรับขึ้นอัตราดอกเบี้ย 25 เบสิสพอยต์เหนือความคาดหมาย



เชื่อมต่อกับเรา









ติดต่อเรา
โทร: +61 2 8036 8388
แฟกซ์: +61 2 8036 8388
อีเมล: support@tmgm.com
เว็บไซต์: https://www.tmgmsea.com



ข้อมูลที่ให้ไว้บนเว็บไซต์นี้มีลักษณะเป็นข้อมูลทั่วไปเท่านั้น และไม่ถือเป็นคำแนะนำทางการเงินส่วนบุคคล ก่อนดำเนินการใด ๆ ตามข้อมูลบนเว็บไซต์นี้ คุณควรพิจารณาความเหมาะสมของข้อมูลดังกล่าวให้สอดคล้องกับวัตถุประสงค์ สถานะทางการเงิน และความต้องการของคุณ การลงทุนใน CFD และสัญญา FX Margin มีความเสี่ยงอย่างมีนัยสำคัญ และไม่เหมาะสำหรับนักลงทุนทุกคน คุณอาจสูญเสียเงินมากกว่าเงินฝากเริ่มต้นของคุณ คุณไม่ได้เป็นเจ้าของ หรือมีส่วนได้เสียใด ๆ ในสินทรัพย์อ้างอิง เราแนะนำให้คุณขอคำแนะนำอย่างเป็นอิสระ และตรวจสอบให้แน่ใจว่าคุณเข้าใจความเสี่ยงที่เกี่ยวข้องอย่างถ่องแท้ก่อนทำการซื้อขาย สิ่งสำคัญคือคุณต้องอ่านและพิจารณาเอกสารการเปิดเผยข้อมูลก่อนที่คุณจะได้มาซึ่งผลิตภัณฑ์ใด ๆ ที่ระบุไว้บนเว็บไซต์ ข้อมูลและโฆษณาที่นำเสนอบนเว็บไซต์นี้ไม่ได้มีวัตถุประสงค์เพื่อให้บุคคลใด ๆ ในประเทศหรือเขตอำนาจศาลใด ๆ ใช้งาน หากการใช้งานดังกล่าวขัดต่อกฎหมายและข้อบังคับท้องถิ่น ผลิตภัณฑ์และบริการที่นำเสนอบนเว็บไซต์นี้ไม่ได้มีไว้สำหรับผู้พำนักอาศัยในสหรัฐอเมริกา มาเลเซีย และประเทศไทย
TMGM ได้รับอนุญาตและอยู่ภายใต้การกำกับดูแลในหลายเขตอำนาจศาล
Trademax Australia Limited ซึ่งดำเนินธุรกิจในชื่อ TMGM ได้รับการกำกับดูแลโดย Australian Securities and Investments Commission (ASIC) หมายเลขใบอนุญาต AFSL 436416 และตั้งอยู่ที่ Level 28, One International Tower, 100 Barangaroo Avenue, 2000 Sydney, NSW Australia.
อีเมล: support@tmgm.com.au
Trademax Global Limited ซึ่งดำเนินธุรกิจในชื่อ TMGM ได้รับอนุญาตและอยู่ภายใต้การกำกับดูแลโดย Vanuatu Financial Services Commission (VFSC) หมายเลขทะเบียน 40356 และจดทะเบียนที่ 1276, Kumul Highway, Port Vila, Vanuatu, Republic of Vanuatu.
อีเมล: support@tmgm.com
Trademax Global Markets (SE) Limited, ดำเนินการภายใต้ชื่อ TMGM, ได้รับอนุญาตและอยู่ภายใต้การกำกับดูแลโดย Financial Services Authority (FSA) ของเซเชลส์ ภายใต้เลขที่ใบอนุญาต SD224 บริษัทจดทะเบียนที่ สำนักงานเลขที่ 13, Providence Estate ABIS Centre, เกาะมาเฮ, เซเชลส์
อีเมล: support@tmgm.com
Trademax Global Markets (International) Pty Ltd ซึ่งดำเนินธุรกิจในชื่อ TMGM ได้รับอนุญาตและอยู่ภายใต้การกำกับดูแลโดย Financial Services Commission, Mauritius (FSC) หมายเลขใบอนุญาต GB22201012 และจดทะเบียนที่ 33, Edith Cavell Street C/o IQ EQ Fund Services (Mauritius) Ltd Port Louis, 11324 Mauritius.
อีเมล: support@tmgm.com
ลิขสิทธิ์ © TMGM สงวนลิขสิทธิ์ทั้งหมด