

Silver Price Forecast: XAG/USD hovers near 200-day SMA, downside risks persist
- Silver steadies above its 200-day SMA after last week's sharp decline.
- Higher-for-longer Fed rate expectations continue to cap demand for the non-yielding metal.
- XAG/USD remains below the 50- and 100-day SMAs, keeping the near-term technical outlook bearish.
Silver (XAG/USD) trades modestly higher on Monday after falling nearly 8% on Friday in the wake of a stronger-than-expected US Nonfarm Payrolls (NFP) report, which reinforced expectations that the Federal Reserve (Fed) will keep interest rates higher for longer.
At the time of writing, XAG/USD is trading around $68.50 after touching $66.18 earlier in the day, its lowest level since March 25.

The mild rebound comes as the US Dollar (USD) softens after Iran's Fars News Agency reported that Iran had ended its military operations against Israel following renewed hostilities over the weekend. US President Donald Trump also said that peace talks with Tehran remain ongoing, keeping traders cautiously optimistic about a possible end to the war in the Middle East.
However, the upside in Silver appears limited amid rising expectations of a hawkish Fed, while the broader technical outlook suggests bears still hold the upper hand.
Traders now look ahead to US inflation data due later this week, which could provide fresh clues on the Fed's monetary policy path and drive the next move in both the USD and XAG/USD.
Technical Analysis:
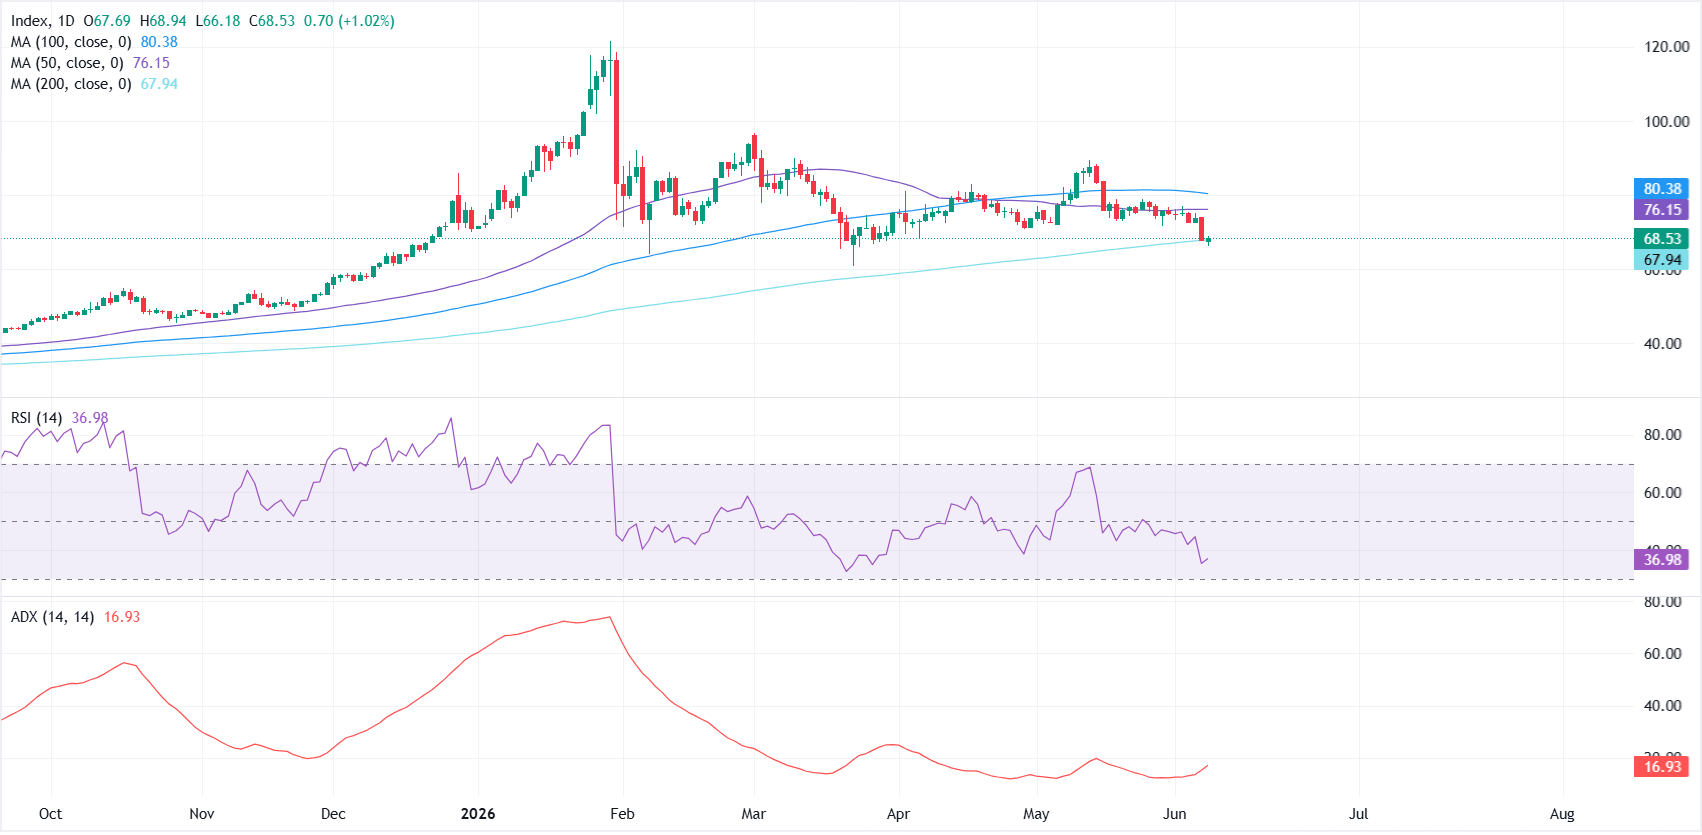
On the daily chart, XAG/USD holds a bearish bias as prices remain below the 50- and 100-day Simple Moving Averages (SMAs). However, the 200-day SMA near $67.94 is providing immediate support and helping to stabilize price action following last week's sharp selloff.
Momentum indicators remain tilted to the downside. The Relative Strength Index (RSI) is hovering around 37, suggesting bearish momentum is still in place, although conditions are not yet oversold. Meanwhile, the Average Directional Index (ADX) near 17 points to a relatively weak trend, indicating that the recent decline has lacked strong conviction.
On the upside, the first resistance level comes in at the 50-day SMA around $76.15. A sustained move above this area could open the door toward the 100-day SMA near $80.38. On the downside, the 200-day SMA at $67.94 remains the key support to watch. A daily close below this level would reinforce the bearish outlook and expose XAG/USD to deeper losses.
(The technical analysis of this story was written with the help of an AI tool.)
US Dollar Price Today
The table below shows the percentage change of US Dollar (USD) against listed major currencies today. US Dollar was the strongest against the Swiss Franc.
| USD | EUR | GBP | JPY | CAD | AUD | NZD | CHF | |
|---|---|---|---|---|---|---|---|---|
| USD | -0.15% | -0.01% | -0.10% | 0.13% | 0.00% | -0.29% | 0.17% | |
| EUR | 0.15% | 0.12% | 0.06% | 0.29% | 0.12% | -0.14% | 0.32% | |
| GBP | 0.01% | -0.12% | -0.09% | 0.14% | -0.02% | -0.30% | 0.15% | |
| JPY | 0.10% | -0.06% | 0.09% | 0.21% | 0.07% | -0.18% | 0.23% | |
| CAD | -0.13% | -0.29% | -0.14% | -0.21% | -0.13% | -0.40% | 0.02% | |
| AUD | -0.01% | -0.12% | 0.02% | -0.07% | 0.13% | -0.27% | 0.17% | |
| NZD | 0.29% | 0.14% | 0.30% | 0.18% | 0.40% | 0.27% | 0.42% | |
| CHF | -0.17% | -0.32% | -0.15% | -0.23% | -0.02% | -0.17% | -0.42% |
The heat map shows percentage changes of major currencies against each other. The base currency is picked from the left column, while the quote currency is picked from the top row. For example, if you pick the US Dollar from the left column and move along the horizontal line to the Japanese Yen, the percentage change displayed in the box will represent USD (base)/JPY (quote).














