

การเทรด
สำรวจตลาดที่หลากหลายด้วยราคาที่แข่งขันได้ สภาพคล่องสูง และเครื่องมือการเทรดขั้นสูง
เรียนรู้เพิ่มเติม 
แพลตฟอร์ม
เทรดอย่างไร้รอยต่อกับแพลตฟอร์มอันทรงพลังของ TMGM ที่สร้างขึ้นเพื่อความรวดเร็ว แม่นยำ และประสบการณ์การเทรดที่เหนือกว่า
เรียนรู้เพิ่มเติม แพลตฟอร์มการเทรด
เครื่องมือการเทรด
สถาบัน
เรียนรู้พื้นฐานการเทรดด้วยแหล่งข้อมูลสำหรับผู้เริ่มต้น รวมถึงคู่มือ สัมมนาออนไลน์ และข้อมูลเชิงลึกตลาด
เรียนรู้เพิ่มเติม ข่าว & วิเคราะห์
รับข้อมูลอัปเดตตลาดแบบเรียลไทม์และบทวิเคราะห์จากผู้เชี่ยวชาญเพื่อคว้าโอกาสการเทรดก่อนใคร
เรียนรู้เพิ่มเติม ข่าว & วิเคราะห์
เกี่ยวกับ
เรียนรู้สิ่งที่ทำให้ TMGM โดดเด่น — การดำเนินงานทั่วโลก ความแข็งแกร่งด้านการกำกับดูแล และความมุ่งมั่นสู่การสร้างสรรค์นวัตกรรมในการเทรด
เรียนรู้เพิ่มเติม ทำไมต้องเลือก TMGM
Ripple Price Forecast: XRP upside capped under $1.00 amid subdued retail and institutional demand
- XRP extends consolidation between lower range limit at $0.90 and upper range limit at $1.00.
- XRP recovery faces falling ETF and retail demand, with futures Open Interest at 1.95 billion XRP.
- XRP’s technical outlook supports early recovery stages, with the RSI rising from oversold territory.
Ripple (XRP) is gradually gaining momentum on Thursday, but remains constrained between $0.90 support and the immediate psychological support at $1.00. Although the path of least resistance is largely downward, sustained buy-the-dip activity in the spot market will likely pave the way for an extended recovery.

Sustained XRP capital outflows risk fresh decline
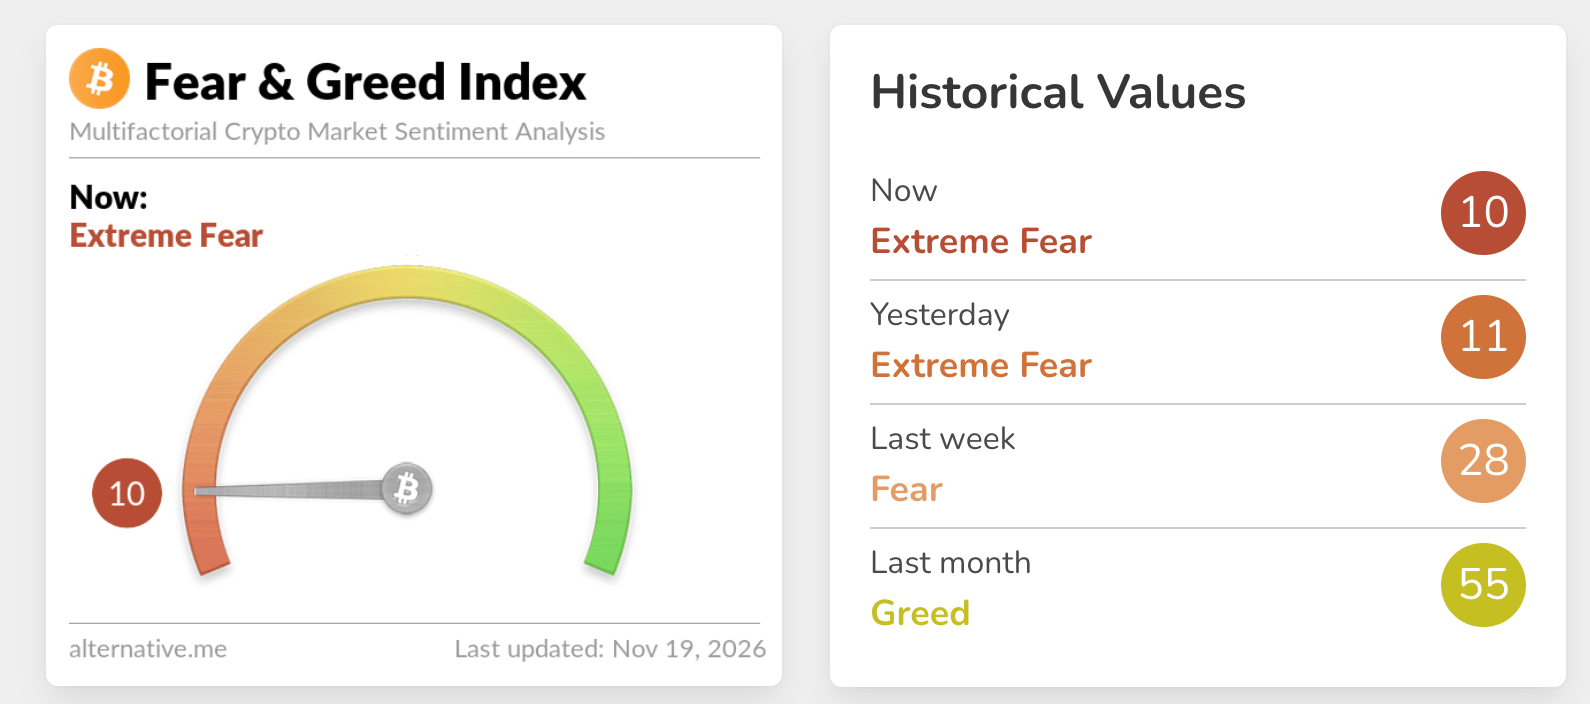
The Fear & Greed Index is at 10 in the Extreme Fear territory on Thursday, down only slightly from 11 in the same range the previous day. Overall, the index has dropped sharply from 55 in the Greed zone last month, undermining risk appetite.
If the crypto market sustains weak sentiment, the path of least resistance would remain firmly downward, capping upside at $1.00 and raising the odds of an extended correction below $0.90. Still, traders should temper their bearish expectations, as extreme fear often coincides with a price turnaround and recovery.
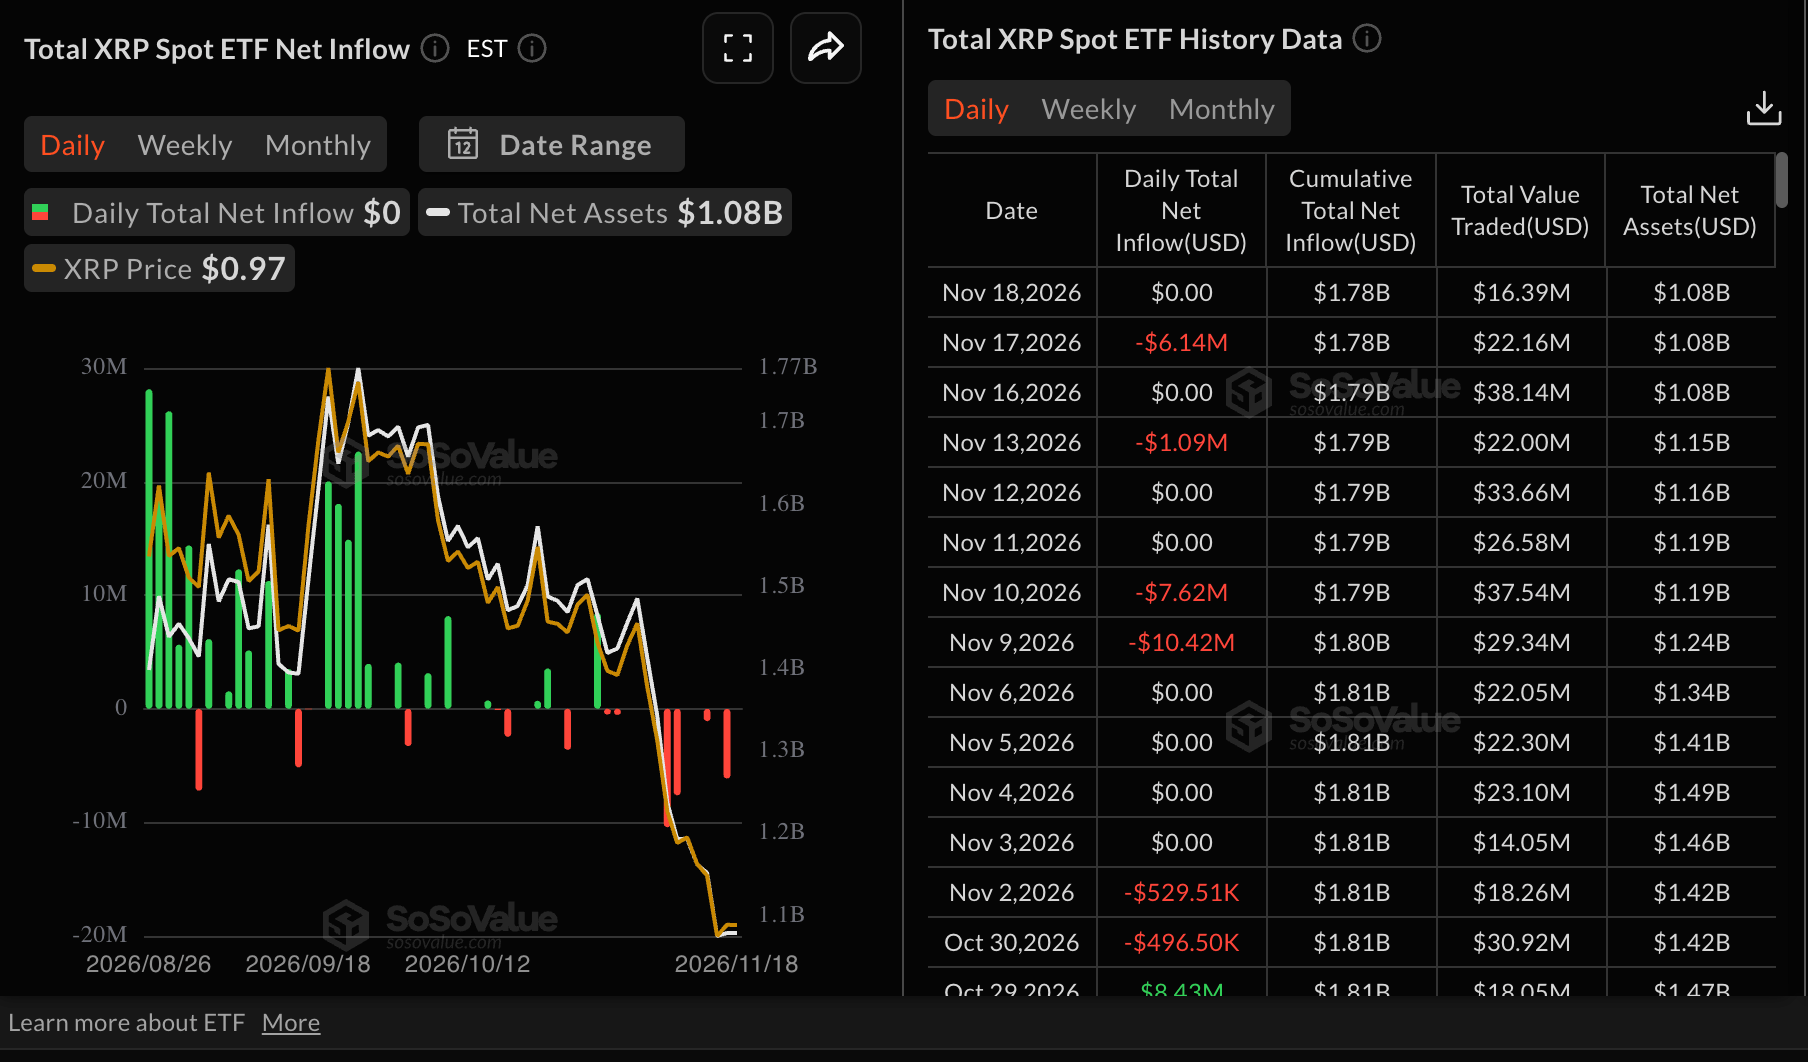
Meanwhile, remained muted on Wednesday, with zero flows. Broadly, the outlook is bearish, given $6 million in outflows the day before and $1 million last Friday. Despite XRP spot ETFs’ first anniversary this month, cumulative inflows average $1.8 billion, with net assets under management at $1.1 billion, suggesting undersubscription compared to Bitcoin (BTC) and Ethereum (ETH).
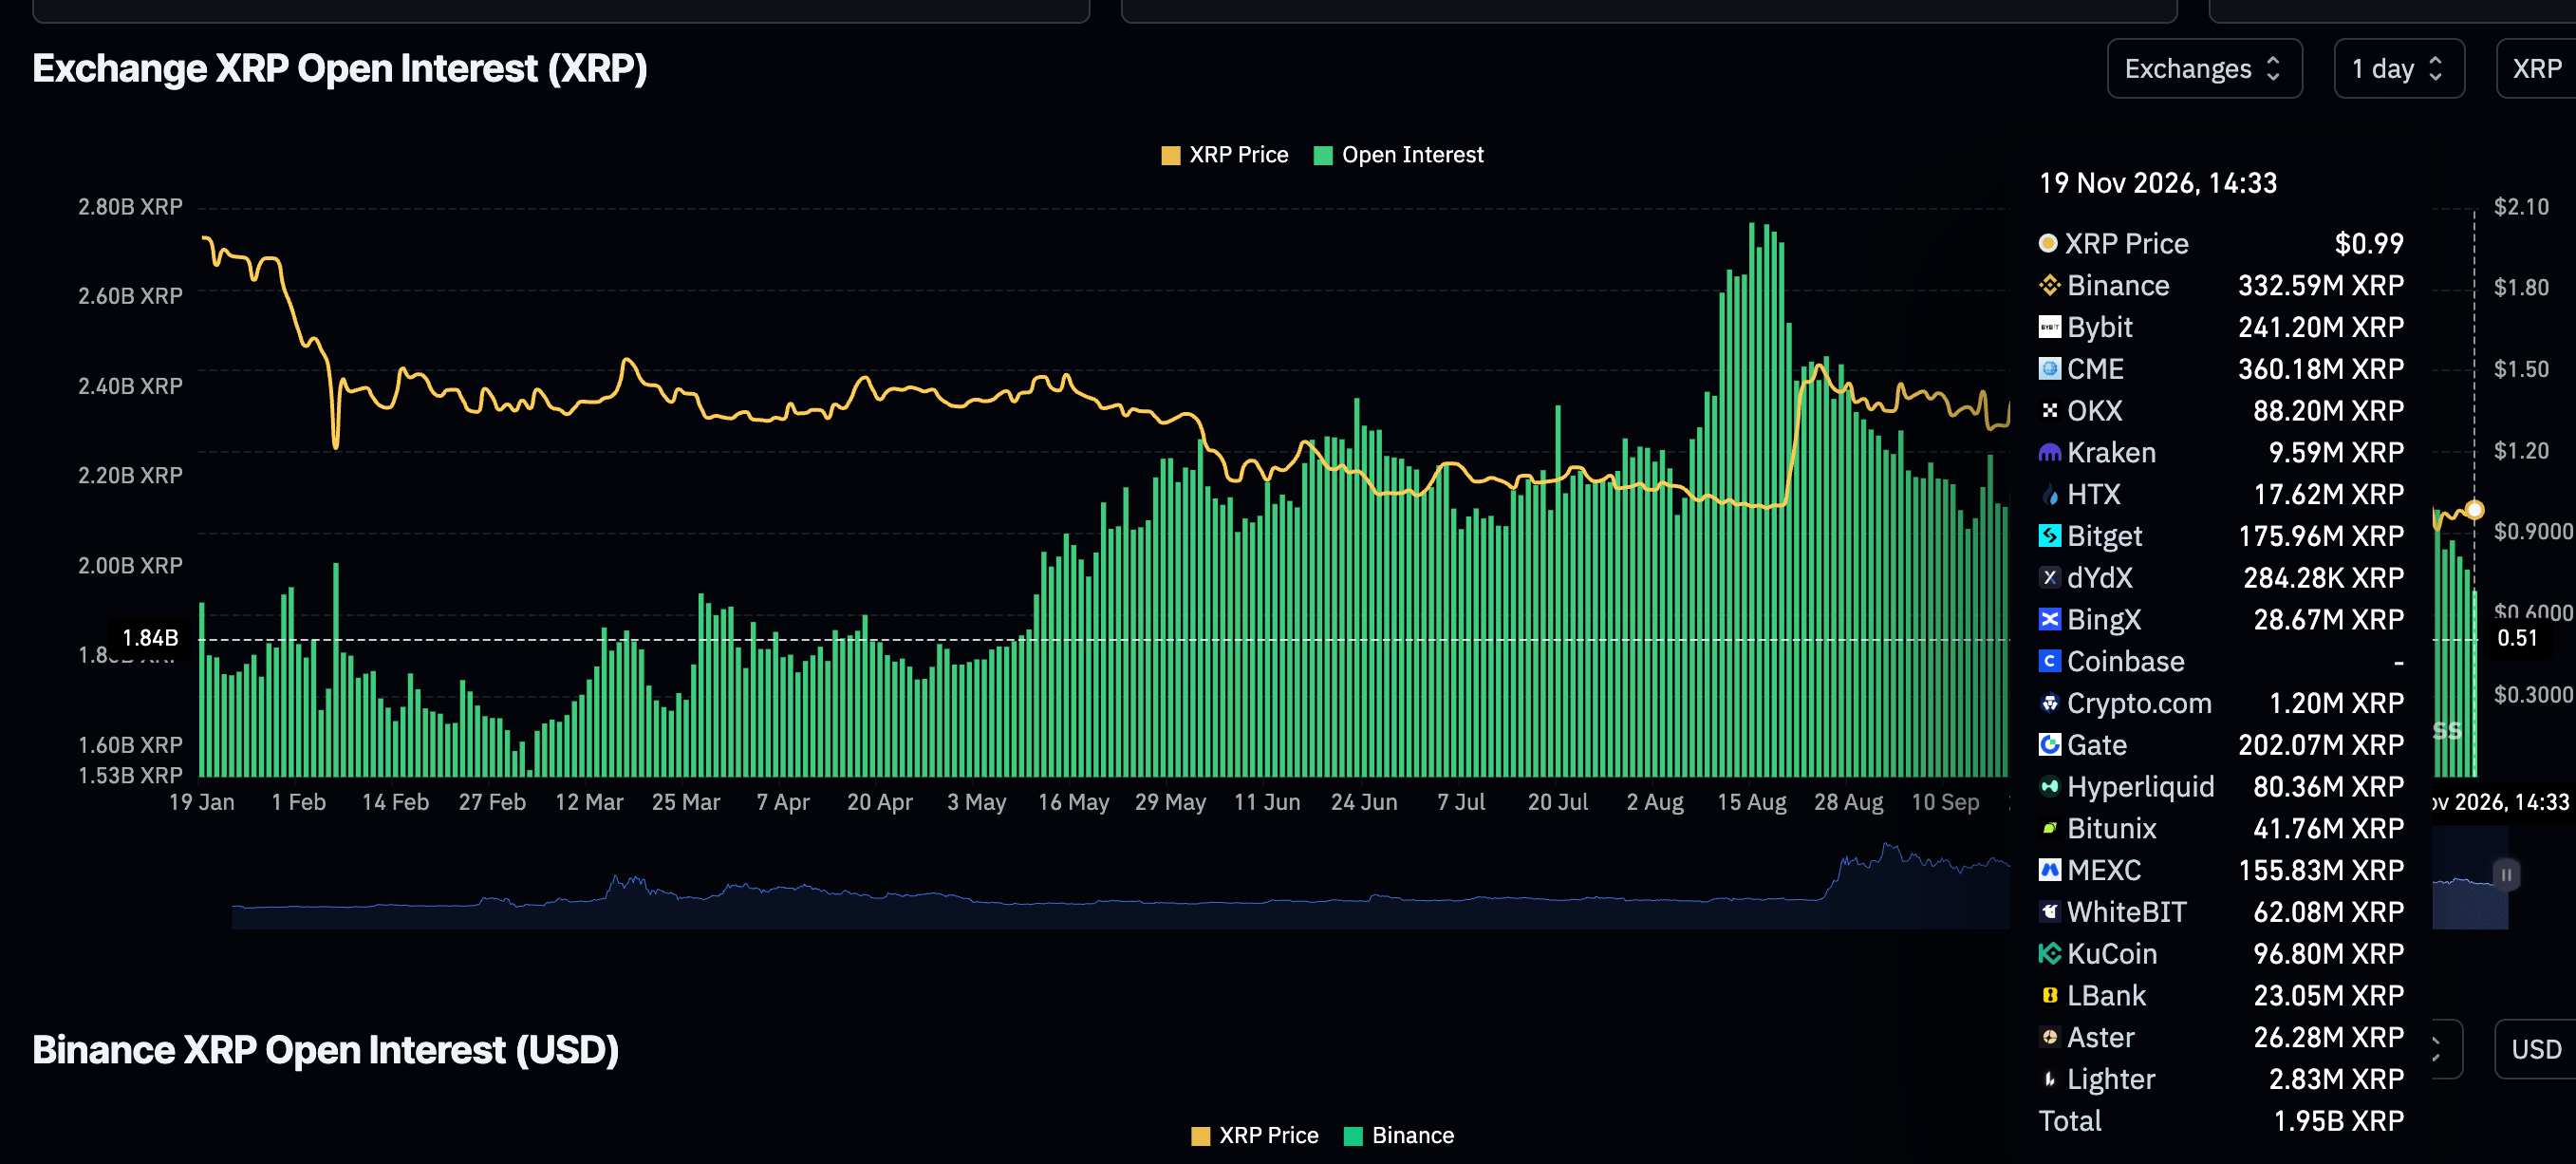
The derivatives market remains weak, as reflected in perpetual futures Open Interest (OI) averaging 1.95 billion XRP on Thursday, down from 2.02 billion XRP the day before. CoinGlass data shows a broader correction from 2.36 billion XRP on November 8 and 2.77 billion farther back in mid-August. Subdued retail demand suggests traders may be deliberately reducing risk exposure or waiting on the sidelines until stability is established before reengaging. This directly impacts demand and lowers recovery potential.
Technical analysis: XRP sustains sideways action
XRP trades around $0.98, extending its decline well below the key Exponential Moving Averages (EMAs), which keeps the near-term bias firmly bearish. The 50-day Exponential Moving Average (EMA) at $1.20, the downward-sloping trendline resistance near $1.22, and the 100-day EMA at $1.25 all sit overhead, suggesting that any rebound would face layered supply before the broader downtrend could ease.
Momentum conditions reinforce this pressured tone, with the Relative Strength Index (RSI) hovering near 32 and the Moving Average Convergence Divergence (MACD) indicator still negative, hinting that sellers retain control despite emerging oversold signals.
Initial resistance lies at the pivotal $1.00, followed by the 50-day EMA around $1.20 and ahead of the descending trendline barrier at $1.22, where prior failures have repeatedly capped recovery attempts. Above that, the 100-day EMA at $1.25 and the more distant 200-day EMA at $1.33 define a broader supply zone that would likely cap any medium-term bounce while price trades below these levels.
With no clear structural support levels highlighted on the daily chart, short-term traders may look to intraday price action and volume spikes to gauge where buyers start to emerge. Still, the technical structure continues to favor rallies being sold into below the clustered moving-average resistance band.
(The technical analysis of this story was written with the help of an AI tool. Know more.)
Open Interest, funding rate FAQs
Higher Open Interest is associated with higher liquidity and new capital inflow to the market. This is considered the equivalent of increase in efficiency and the ongoing trend continues. When Open Interest decreases, it is considered a sign of liquidation in the market, investors are leaving and the overall demand for an asset is on a decline, fueling a bearish sentiment among investors.
Funding fees bridge the difference between spot prices and prices of futures contracts of an asset by increasing liquidation risks faced by traders. A consistently high and positive funding rate implies there is a bullish sentiment among market participants and there is an expectation of a price hike. A consistently negative funding rate for an asset implies a bearish sentiment, indicating that traders expect the cryptocurrency’s price to fall and a bearish trend reversal is likely to occur.
บทความยอดนิยม
1ทองคำ: แนวโน้มขาลงต่อเนื่อง โดยมีเป้าหมายราคาที่ต่ำลง – Societe Generale2ดอลลาร์สหรัฐ: ได้แรงหนุนจากความเสี่ยงเงินเฟ้อที่ยังคงอยู่ – UOB3คาดการณ์ราคา USD/CAD: ดอลลาร์ทดสอบแนวรับบริเวณ 1.4300 หลังไม่ผ่านแนวต้านที่ 1.43604เงินเยนอ่อนค่าเทียบปอนด์อังกฤษ ขณะบรรยากาศตลาดปรับตัวดีขึ้น5แรนด์แอฟริกาใต้: ยังมีโอกาสฟื้นตัวเมื่อเทียบกับดอลลาร์สหรัฐ - ING6ดอลลาร์ออสเตรเลีย: ข้อมูลจ้างงานอ่อนแอหนุนคาดการณ์ลดดอกเบี้ย – BBH7ฟรังก์สวิส: อ่อนค่าลงขณะดอลลาร์ฟื้นตัวต่อเนื่อง – UOB8คาดการณ์ราคา USD/JPY: มีแนวโน้มปรับขึ้นต่อหากทะลุ 160.409ดอลลาร์สหรัฐ: สัญญาณคุมเข้มนโยบายการเงินจากเฟดหนุนแนวโน้มดอลลาร์ - Danske Bank



เชื่อมต่อกับเรา









ติดต่อเรา
โทร: +61 2 8036 8388
แฟกซ์: +61 2 8036 8388
อีเมล: support@tmgm.com
เว็บไซต์: https://www.tmgmsea.com



ข้อมูลที่ให้ไว้บนเว็บไซต์นี้มีลักษณะเป็นข้อมูลทั่วไปเท่านั้น และไม่ถือเป็นคำแนะนำทางการเงินส่วนบุคคล ก่อนดำเนินการใด ๆ ตามข้อมูลบนเว็บไซต์นี้ คุณควรพิจารณาความเหมาะสมของข้อมูลดังกล่าวให้สอดคล้องกับวัตถุประสงค์ สถานะทางการเงิน และความต้องการของคุณ การลงทุนใน CFD และสัญญา FX Margin มีความเสี่ยงอย่างมีนัยสำคัญ และไม่เหมาะสำหรับนักลงทุนทุกคน คุณอาจสูญเสียเงินมากกว่าเงินฝากเริ่มต้นของคุณ คุณไม่ได้เป็นเจ้าของ หรือมีส่วนได้เสียใด ๆ ในสินทรัพย์อ้างอิง เราแนะนำให้คุณขอคำแนะนำอย่างเป็นอิสระ และตรวจสอบให้แน่ใจว่าคุณเข้าใจความเสี่ยงที่เกี่ยวข้องอย่างถ่องแท้ก่อนทำการซื้อขาย สิ่งสำคัญคือคุณต้องอ่านและพิจารณาเอกสารการเปิดเผยข้อมูลก่อนที่คุณจะได้มาซึ่งผลิตภัณฑ์ใด ๆ ที่ระบุไว้บนเว็บไซต์ ข้อมูลและโฆษณาที่นำเสนอบนเว็บไซต์นี้ไม่ได้มีวัตถุประสงค์เพื่อให้บุคคลใด ๆ ในประเทศหรือเขตอำนาจศาลใด ๆ ใช้งาน หากการใช้งานดังกล่าวขัดต่อกฎหมายและข้อบังคับท้องถิ่น ผลิตภัณฑ์และบริการที่นำเสนอบนเว็บไซต์นี้ไม่ได้มีไว้สำหรับผู้พำนักอาศัยในสหรัฐอเมริกา มาเลเซีย และประเทศไทย
TMGM ได้รับอนุญาตและอยู่ภายใต้การกำกับดูแลในหลายเขตอำนาจศาล
Trademax Australia Limited ซึ่งดำเนินธุรกิจในชื่อ TMGM ได้รับการกำกับดูแลโดย Australian Securities and Investments Commission (ASIC) หมายเลขใบอนุญาต AFSL 436416 และตั้งอยู่ที่ Level 28, One International Tower, 100 Barangaroo Avenue, 2000 Sydney, NSW Australia.
อีเมล: support@tmgm.com.au
Trademax Global Limited ซึ่งดำเนินธุรกิจในชื่อ TMGM ได้รับอนุญาตและอยู่ภายใต้การกำกับดูแลโดย Vanuatu Financial Services Commission (VFSC) หมายเลขทะเบียน 40356 และจดทะเบียนที่ 1276, Kumul Highway, Port Vila, Vanuatu, Republic of Vanuatu.
อีเมล: support@tmgm.com
Trademax Global Markets (SE) Limited, ดำเนินการภายใต้ชื่อ TMGM, ได้รับอนุญาตและอยู่ภายใต้การกำกับดูแลโดย Financial Services Authority (FSA) ของเซเชลส์ ภายใต้เลขที่ใบอนุญาต SD224 บริษัทจดทะเบียนที่ สำนักงานเลขที่ 13, Providence Estate ABIS Centre, เกาะมาเฮ, เซเชลส์
อีเมล: support@tmgm.com
Trademax Global Markets (International) Pty Ltd ซึ่งดำเนินธุรกิจในชื่อ TMGM ได้รับอนุญาตและอยู่ภายใต้การกำกับดูแลโดย Financial Services Commission, Mauritius (FSC) หมายเลขใบอนุญาต GB22201012 และจดทะเบียนที่ 33, Edith Cavell Street C/o IQ EQ Fund Services (Mauritius) Ltd Port Louis, 11324 Mauritius.
อีเมล: support@tmgm.com
ลิขสิทธิ์ © TMGM สงวนลิขสิทธิ์ทั้งหมด