

Торговля
Изучите широкий спектр рынков с конкурентными ценами, высокой ликвидностью и передовыми торговыми инструментами.
Узнать больше 
Платформа
Торгуйте без сбоев на мощной платформе TMGM, созданной для скорости, точности и превосходного торгового опыта.
Узнать больше Торговая платформа
Торговые инструменты
Академия
Изучите основы торговли с помощью материалов для начинающих, включая руководства, вебинары и аналитические обзоры рынка.
Узнать больше Новости и аналитика
Получайте актуальные рыночные обновления и экспертную аналитику, чтобы быть на шаг впереди торговых возможностей
Узнать больше Новости и аналитика
О нас
Узнайте, что отличает TMGM — наше глобальное присутствие, надежное регулирование и приверженность инновациям в трейдинге.
Узнать больше Почему выбирают TMGM
Спонсорство
NZD/USD Price Forecast: Bears eye 18-months low at 0.5564
- NZD/USD retreats beyond 1.3% on Wednesday and nears 1-month lows at 0.5565.
- The Kiwi plummeted after the RBNZ left interest rates on hold, against market expectations of a rate hike.
- Failure to extend gains above 0.5700 leaves the broader bearish trend in play.
The New Zealand Dollar (NZD) sells off across the board on Wednesday and dives more than 1.3% against the US Dollar (USD) following the Reserve Bank of New Zealand’s (RBNZ) monetary policy decision. The NZD/USD pair trades at 0.5600 after hitting two-week lows at 0.5584, with bulls still focused on the 18-month low at 0.5564.

The RBNZ left its Official Cash Rate (OCR) unchanged at 2.75% earlier on Wednesday, disappointing investors who were nearly fully pricing in a quarter-point rate hike. The Kiwi tanked after the decision, and trimmed some losses afterwards, as Governor Anna Breman hinted at further monetary tightening in December.
The focus now is on the US Federal Reserve, which will release its monetary policy decision at 18:00 GMT. The bank is widely expected to leave rates unchanged, and investors will be looking at Chairman Warsh’s press release to confirm expectations of a further rate hike in December.
Technical Analysis: NZD/USD remains vulnerable while below 0.5700
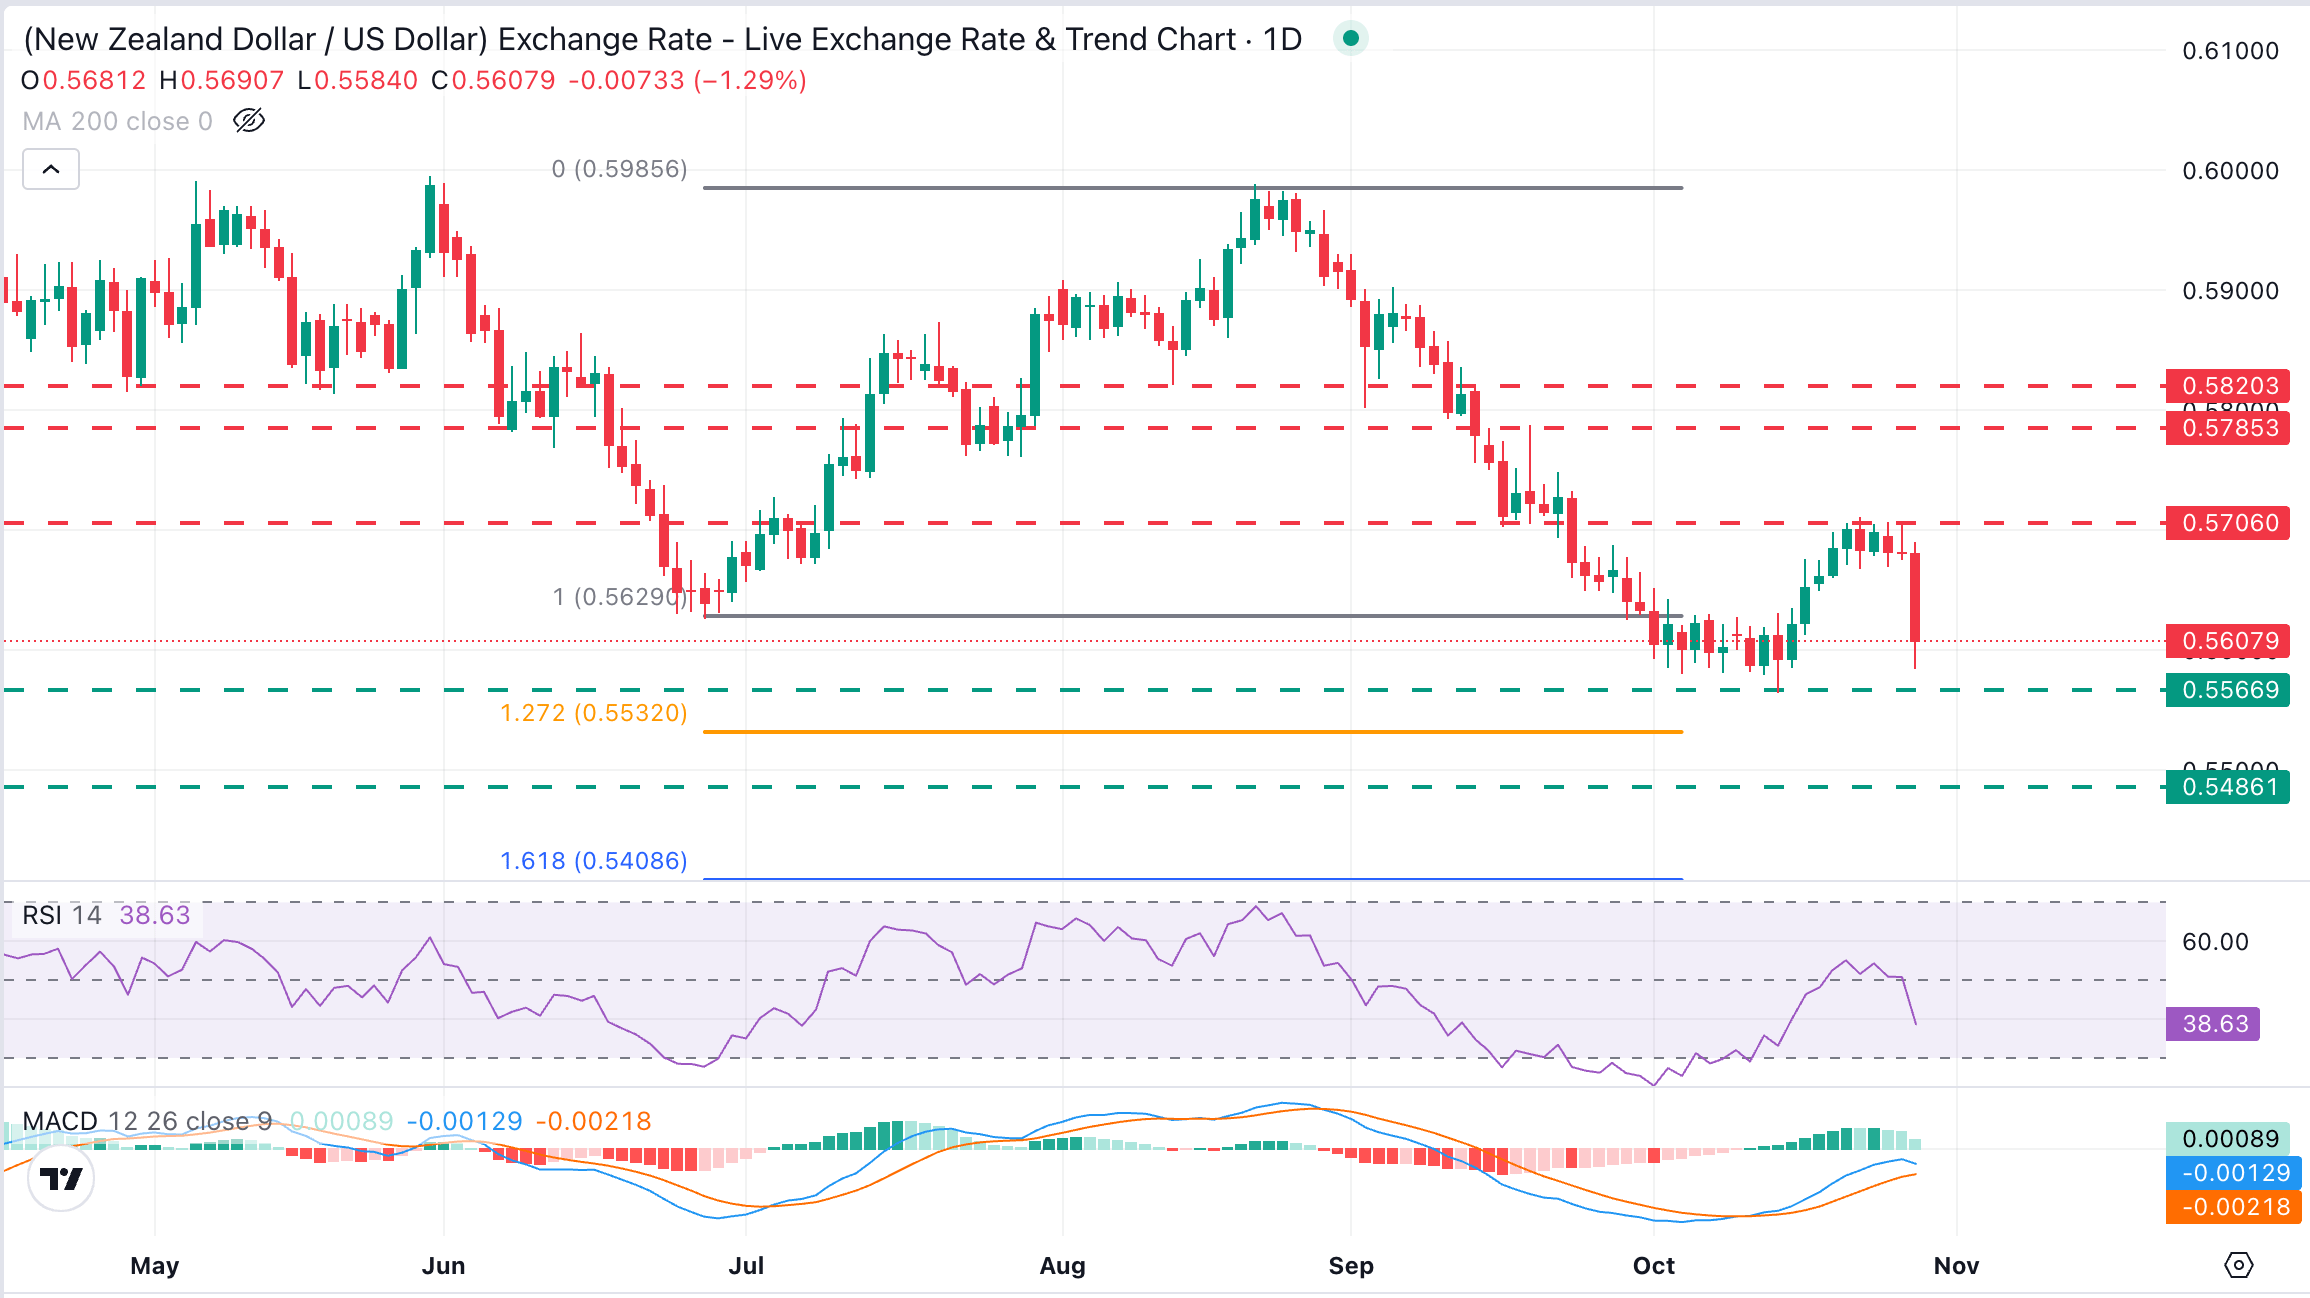
NZD/USD trades at 0.5607, keeping a bearish near-term tone as spot holds beneath a previous support area around 0.5700. Momentum indicators in the daily chart are mixed, with the Relative Strength Index (14) below 40, after coming up from oversold territory but still pointing to subdued demand. The Moving Average Convergence Divergence (MACD), on the other hand, is just above zero, hinting at only tentative upside attempts within a broader capped environment.
Bears are focusing on the October 14 low at 0.8564. Further down, the 127.2% Fibonacci retracement of the June-August rally, near 0.5530, might provide some support ahead of the April 2026 low at 0.5485.
On the topside, the 0.5700 area has proved a meaningful barrier over the last week, closing the path towartds the September 18 high at 0.5787 and the mid-August and early-September supports between 0.5800 and 0.5820.
(The technical analysis of this story was written with the help of an AI tool. Know more.)
New Zealand Dollar Price Today
The table below shows the percentage change of New Zealand Dollar (NZD) against listed major currencies today. New Zealand Dollar was the strongest against the British Pound.
| USD | EUR | GBP | JPY | CAD | AUD | NZD | CHF | |
|---|---|---|---|---|---|---|---|---|
| USD | -0.01% | 0.16% | -0.03% | -0.07% | -0.10% | 1.30% | 0.10% | |
| EUR | 0.01% | 0.17% | -0.02% | -0.06% | -0.09% | 1.31% | 0.11% | |
| GBP | -0.16% | -0.17% | -0.17% | -0.23% | -0.26% | 1.14% | -0.07% | |
| JPY | 0.03% | 0.02% | 0.17% | -0.05% | -0.07% | 1.32% | 0.12% | |
| CAD | 0.07% | 0.06% | 0.23% | 0.05% | -0.03% | 1.37% | 0.18% | |
| AUD | 0.10% | 0.09% | 0.26% | 0.07% | 0.03% | 1.41% | 0.20% | |
| NZD | -1.30% | -1.31% | -1.14% | -1.32% | -1.37% | -1.41% | -1.17% | |
| CHF | -0.10% | -0.11% | 0.07% | -0.12% | -0.18% | -0.20% | 1.17% |
The heat map shows percentage changes of major currencies against each other. The base currency is picked from the left column, while the quote currency is picked from the top row. For example, if you pick the New Zealand Dollar from the left column and move along the horizontal line to the US Dollar, the percentage change displayed in the box will represent NZD (base)/USD (quote).
Лучшие статьи
1Australian Dollar: Hot CPI bolsters RBA hike prospects – BBH2UK Budget: Healey walks a fiscal tightrope as 2027 growth outlook darkens3Silver Price Forecast: Descending channel keeps sellers in control ahead of Fed4New Zealand Dollar: RBNZ split keeps December hike in play - UOB5Swiss Franc ticks up from two-week lows with Fed decision on tap6Canadian Dollar: BoC guidance key to CAD outlook - Commerzbank7British Pound: Budget may boost Sterling against Euro - ING8Australian Dollar: RBA may hike again as inflation persists - Standard Chartered9XRP recovery stalls as Ripple and Robinhood expand partnership scope
РЫНОЧНЫЕ КОТИРОВКИ


ВСЁ О FOREX
Stop Loss: What It Is, How It Works and How to Set One
Margin Call Meaning: What It Is, What Triggers It and How to Avoid One
Top 15 Weakest Currencies in the World
Top 15 Strongest Currencies in the World
Is Forex Trading Halal?
Best Time to Trade Forex
Forex Trading vs Futures Trading
Forex Trading vs Stock Trading
Forex Trading vs Crypto Trading
Начать!
Зарегистрируйтесь и получите доступ к глобальным рынкам менее чем за 3 минуты

Свяжитесь с нами









Контакты
Телефон: +61 2 8036 8388
Факс: +61 2 8036 8388
Эл. почта: support@tmgm.com
Веб-сайт: https://www.tmgmsea.com



Информация, представленная на этом веб-сайте, носит исключительно общий характер и не является персональной финансовой консультацией. Прежде чем действовать на основании любой информации на этом веб-сайте, вам следует оценить ее уместность с учетом ваших целей, финансового положения и потребностей. Инвестирование в CFD и маржинальные контракты на FX сопряжено со значительными рисками и подходит не всем инвесторам. Вы можете потерять больше, чем ваш первоначальный депозит. Вы не владеете базовым активом и не имеете в нем какой-либо доли. Мы рекомендуем вам обратиться за независимой консультацией и убедиться, что вы полностью понимаете связанные с этим риски, прежде чем начинать торговлю. Важно прочитать и принять во внимание документ с раскрытием информации, прежде чем приобретать любой продукт, указанный на веб-сайте. Информация и рекламные материалы, предлагаемые на этом веб-сайте, не предназначены для использования любым лицом в любой стране или юрисдикции, где такое использование противоречило бы местным законам и нормативным актам. Продукты и услуги, предлагаемые на этом веб-сайте, не предназначены для резидентов США, Малайзии и Таиланда.
TMGM уполномочена и регулируется в различных юрисдикциях.
Trademax Australia Limited, работающая под брендом TMGM, регулируется Australian Securities and Investments Commission (ASIC), AFSL № 436416 и находится по адресу: Level 28, One International Tower, 100 Barangaroo Avenue, 2000 Sydney, NSW Australia.
Email: support@tmgm.com.au
Trademax Global Limited, работающая под брендом TMGM, уполномочена и регулируется Vanuatu Financial Services Commission (VFSC), регистрационный номер 40356, и зарегистрирована по адресу: 1276, Kumul Highway, Port Vila, Vanuatu, Republic of Vanuatu.
Email: support@tmgm.com
Trademax Global Markets (SE) Limited, работающая под брендом TMGM, уполномочена и регулируется Financial Services Authority (FSA) Сейшельских Островов, номер лицензии SD224. Компания зарегистрирована по адресу: Office No 13, Providence Estate ABIS Centre, Mahe, Seychelles.
Email: support@tmgm.com
Trademax Global Markets (International) Pty Ltd, работающая под брендом TMGM, уполномочена и регулируется Financial Services Commission, Mauritius (FSC), лицензия № GB22201012, и зарегистрирована по адресу: 33, Edith Cavell Street C/o IQ EQ Fund Services (Mauritius) Ltd Port Louis, 11324 Mauritius.
Email: support@tmgm.com
Авторское право © TMGM. Все права защищены