

Trading
Explora una amplia gama de mercados con precios competitivos, liquidez profunda y herramientas de trading avanzadas.
Más información 
Plataforma
Opera sin interrupciones con la potente plataforma de TMGM, diseñada para ofrecer velocidad, precisión y una experiencia de trading superior.
Más información Plataforma de trading
Herramientas de trading
Academia
Aprende los fundamentos del trading con recursos ideales para principiantes, incluidas guías, seminarios web y análisis del mercado.
Más información Academia TMGM
Noticias y análisis
Obtén actualizaciones del mercado en tiempo real y análisis de expertos para adelantarte a las oportunidades de trading
Más información Noticias y análisis
Acerca de
Descubre qué distingue a TMGM: nuestra presencia global, solidez regulatoria y compromiso con la innovación en el trading.
Más información Por qué elegir TMGM
USD/CHF Price Forecast: Buyers retain control as RSI nears overbought territory
- USD/CHF consolidates near levels last seen in May 2025 amid a hawkish Fed outlook.
- Buyers remain in control as the pair trades above its 50-, 100- and 200-day SMAs.
- RSI approaches overbought territory as bulls target 0.8500.
USD/CHF treads water on Thursday as US Dollar (USD) bulls take a breather after the recent rally. The Swiss National Bank’s (SNB) zero policy rate and growing bets on additional interest rate hikes by the Federal Reserve (Fed) continue to favour the Greenback over the Swiss Franc (CHF).

At the time of writing, the pair trades around 0.8424, near levels last seen in May 2025. The US Dollar Index (DXY), which tracks the Greenback against a basket of six major currencies, trades around 103.70 after touching a 19-month high of 103.97 earlier in the day.
Franc seen undervalued as markets overprice SNB tightening
Strategists at BNY highlight that current “CHF rate pricing continues to confound,” noting that the Franc has “the weakest relationship with yields – at times clearly negative – albeit for different reasons.” According to the bank, they “remain astounded that markets price more than two Swiss National Bank (SNB) hikes over the next four meetings,” given that “inflation remains well below target throughout the SNB’s forecast horizon.” In their view, “the franc remains undervalued in real terms,” and they expect “heightened risk aversion toward year-end to support performance, irrespective of changes in rate expectations.”
Technical analysis
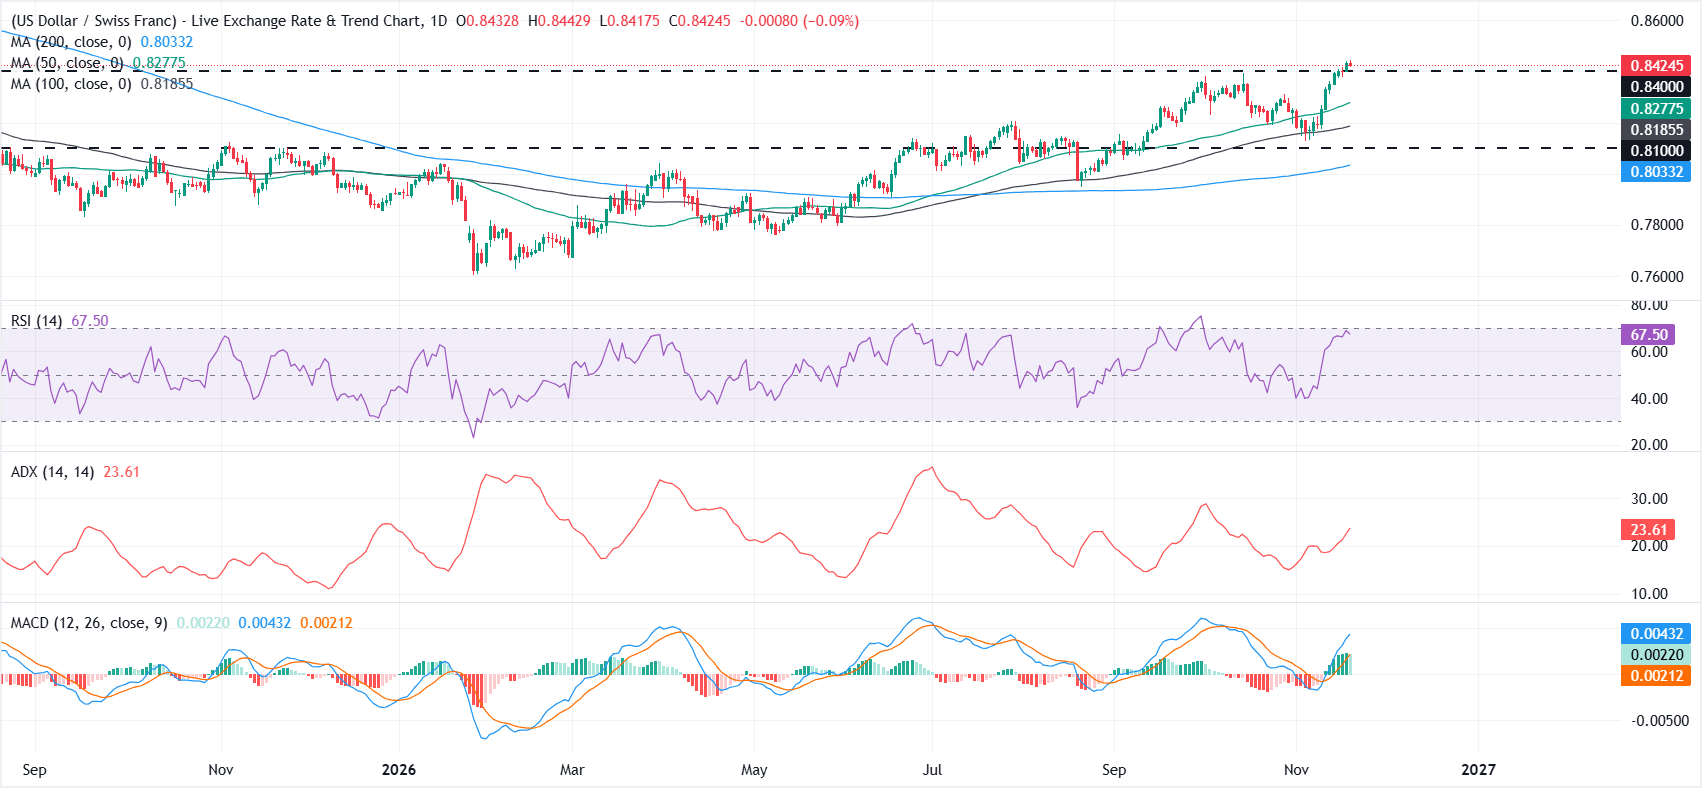
On the daily chart, USD/CHF is extending its recovery above all the main moving averages and reinforcing a bullish near-term bias. The 50-day simple moving average (SMA), the 100-day SMA and the 200-day SMA all sit comfortably below price, suggesting a maturing upside trend structure.
Momentum backs this constructive tone, with the Relative Strength Index (RSI) holding near 68 in near-overbought territory and the Moving Average Convergence Divergence (MACD) above zero with the line positive, hinting at sustained buying pressure.
On the downside, immediate support emerges at the horizontal level around 0.8400, followed by the 0.8300 psychological mark, closely aligned with the 50-day SMA at 0.8278, which could offer further support on deeper pullbacks.
Below there, the 100-day SMA at 0.8186 and the prior horizontal floor at 0.8100 form a broader demand area, while the 200-day SMA at 0.8033 marks a more distant structural base for the pair. On the upside, if buyers defend the 0.8400 level, the pair could extend its advance toward the psychological 0.8500 mark.
(The technical analysis of this story was written with the help of an AI tool. Know more.)
Swiss Franc Price Today
The table below shows the percentage change of Swiss Franc (CHF) against listed major currencies today. Swiss Franc was the strongest against the Japanese Yen.
| USD | EUR | GBP | JPY | CAD | AUD | NZD | CHF | |
|---|---|---|---|---|---|---|---|---|
| USD | -0.17% | -0.06% | 0.37% | -0.19% | 0.06% | -0.63% | -0.08% | |
| EUR | 0.17% | 0.11% | 0.56% | -0.01% | 0.24% | -0.47% | 0.08% | |
| GBP | 0.06% | -0.11% | 0.46% | -0.13% | 0.12% | -0.58% | -0.03% | |
| JPY | -0.37% | -0.56% | -0.46% | -0.58% | -0.31% | -1.03% | -0.48% | |
| CAD | 0.19% | 0.01% | 0.13% | 0.58% | 0.26% | -0.44% | 0.11% | |
| AUD | -0.06% | -0.24% | -0.12% | 0.31% | -0.26% | -0.68% | -0.16% | |
| NZD | 0.63% | 0.47% | 0.58% | 1.03% | 0.44% | 0.68% | 0.57% | |
| CHF | 0.08% | -0.08% | 0.03% | 0.48% | -0.11% | 0.16% | -0.57% |
The heat map shows percentage changes of major currencies against each other. The base currency is picked from the left column, while the quote currency is picked from the top row. For example, if you pick the Swiss Franc from the left column and move along the horizontal line to the US Dollar, the percentage change displayed in the box will represent CHF (base)/USD (quote).
Artículos destacados
1Yen japonés: se debilita hacia los 160 frente al dólar estadounidense ante la proximidad de una subida de tipos del Banco de Japón - BBH2Previsión del precio de Ripple: el potencial alcista de XRP se ve limitado por debajo de 1,00 $ ante la débil demanda minorista e institucional3Oro: la tendencia bajista se prolonga con objetivos más bajos – Societe Generale4Dólar estadounidense: respaldado por los persistentes riesgos inflacionarios – UOB5Previsión del USD/CAD: el dólar pone a prueba el soporte en torno a 1,4300 tras el rechazo en 1,43606El yen japonés retrocede frente a la libra esterlina ante la mejora del sentimiento del mercado7Rand sudafricano: margen para recuperarse frente al dólar estadounidense - ING8Dólar australiano: los débiles datos de empleo refuerzan las apuestas por un recorte de tipos – BBH9Franco suizo: se debilita mientras el dólar prolonga su repunte – UOB


¡Comience ahora!
Regístrese y acceda a los mercados globales en menos de 3 minutos

Conéctese con nosotros









Contactos
Teléfono: +61 2 8036 8388
Fax: +61 2 8036 8388
Correo electrónico: support@tmgm.com



La información proporcionada en este sitio web es únicamente de carácter general y no constituye asesoramiento financiero personal. Antes de actuar sobre cualquier información de este sitio web, debe considerar la idoneidad de la información en relación con sus objetivos, situación financiera y necesidades. Invertir en CFD y contratos de margen de FX conlleva riesgos significativos y no es adecuado para todos los inversores. Puede perder más que su depósito inicial. Usted no posee ni tiene ningún interés en el activo subyacente. Le recomendamos que busque asesoramiento independiente y se asegure de comprender plenamente los riesgos involucrados antes de operar. Es importante que lea y considere el documento de divulgación antes de adquirir cualquier producto listado en el sitio web. La información y los anuncios ofrecidos en este sitio web no están destinados al uso por parte de ninguna persona en ningún país o jurisdicción donde dicho uso sea contrario a las leyes y regulaciones locales. Los productos y servicios ofrecidos en este sitio web no están destinados a residentes de Estados Unidos, Malasia y Tailandia.
TMGM está autorizado y regulado en varias jurisdicciones.
Trademax Australia Limited, que opera como TMGM, está regulada por la Comisión Australiana de Valores e Inversiones (ASIC), AFSL n.º 436416, y está ubicada en Level 28, One International Tower, 100 Barangaroo Avenue, 2000 Sydney, NSW Australia.
Correo electrónico: support@tmgm.com.au
Trademax Global Limited, que opera como TMGM, está autorizada y regulada por la Comisión de Servicios Financieros de Vanuatu (VFSC), número de registro 40356, y está registrada en 1276, Kumul Highway, Port Vila, Vanuatu, República de Vanuatu.
Correo electrónico: support@tmgm.com
Trademax Global Markets (SE) Limited, que opera como TMGM, está autorizada y regulada por la Autoridad de Servicios Financieros (FSA) de Seychelles, con número de licencia SD224. La empresa está registrada en Office No 13, Providence Estate ABIS Centre, Mahe, Seychelles.
Correo electrónico: support@tmgm.com
Trademax Global Markets (International) Pty Ltd, que opera como TMGM, está autorizada y regulada por la Comisión de Servicios Financieros de Mauricio (FSC) con licencia n.º GB22201012, y está registrada en 33, Edith Cavell Street C/o IQ EQ Fund Services (Mauritius) Ltd Port Louis, 11324 Mauricio.
Correo electrónico: support@tmgm.com
Copyright © TMGM. Todos los derechos reservados