




Pi Network Price Forecast: Mild bearish bias caps PI corrective rebound
- Pi Network edges lower on Monday, after a 5% rebound last week.
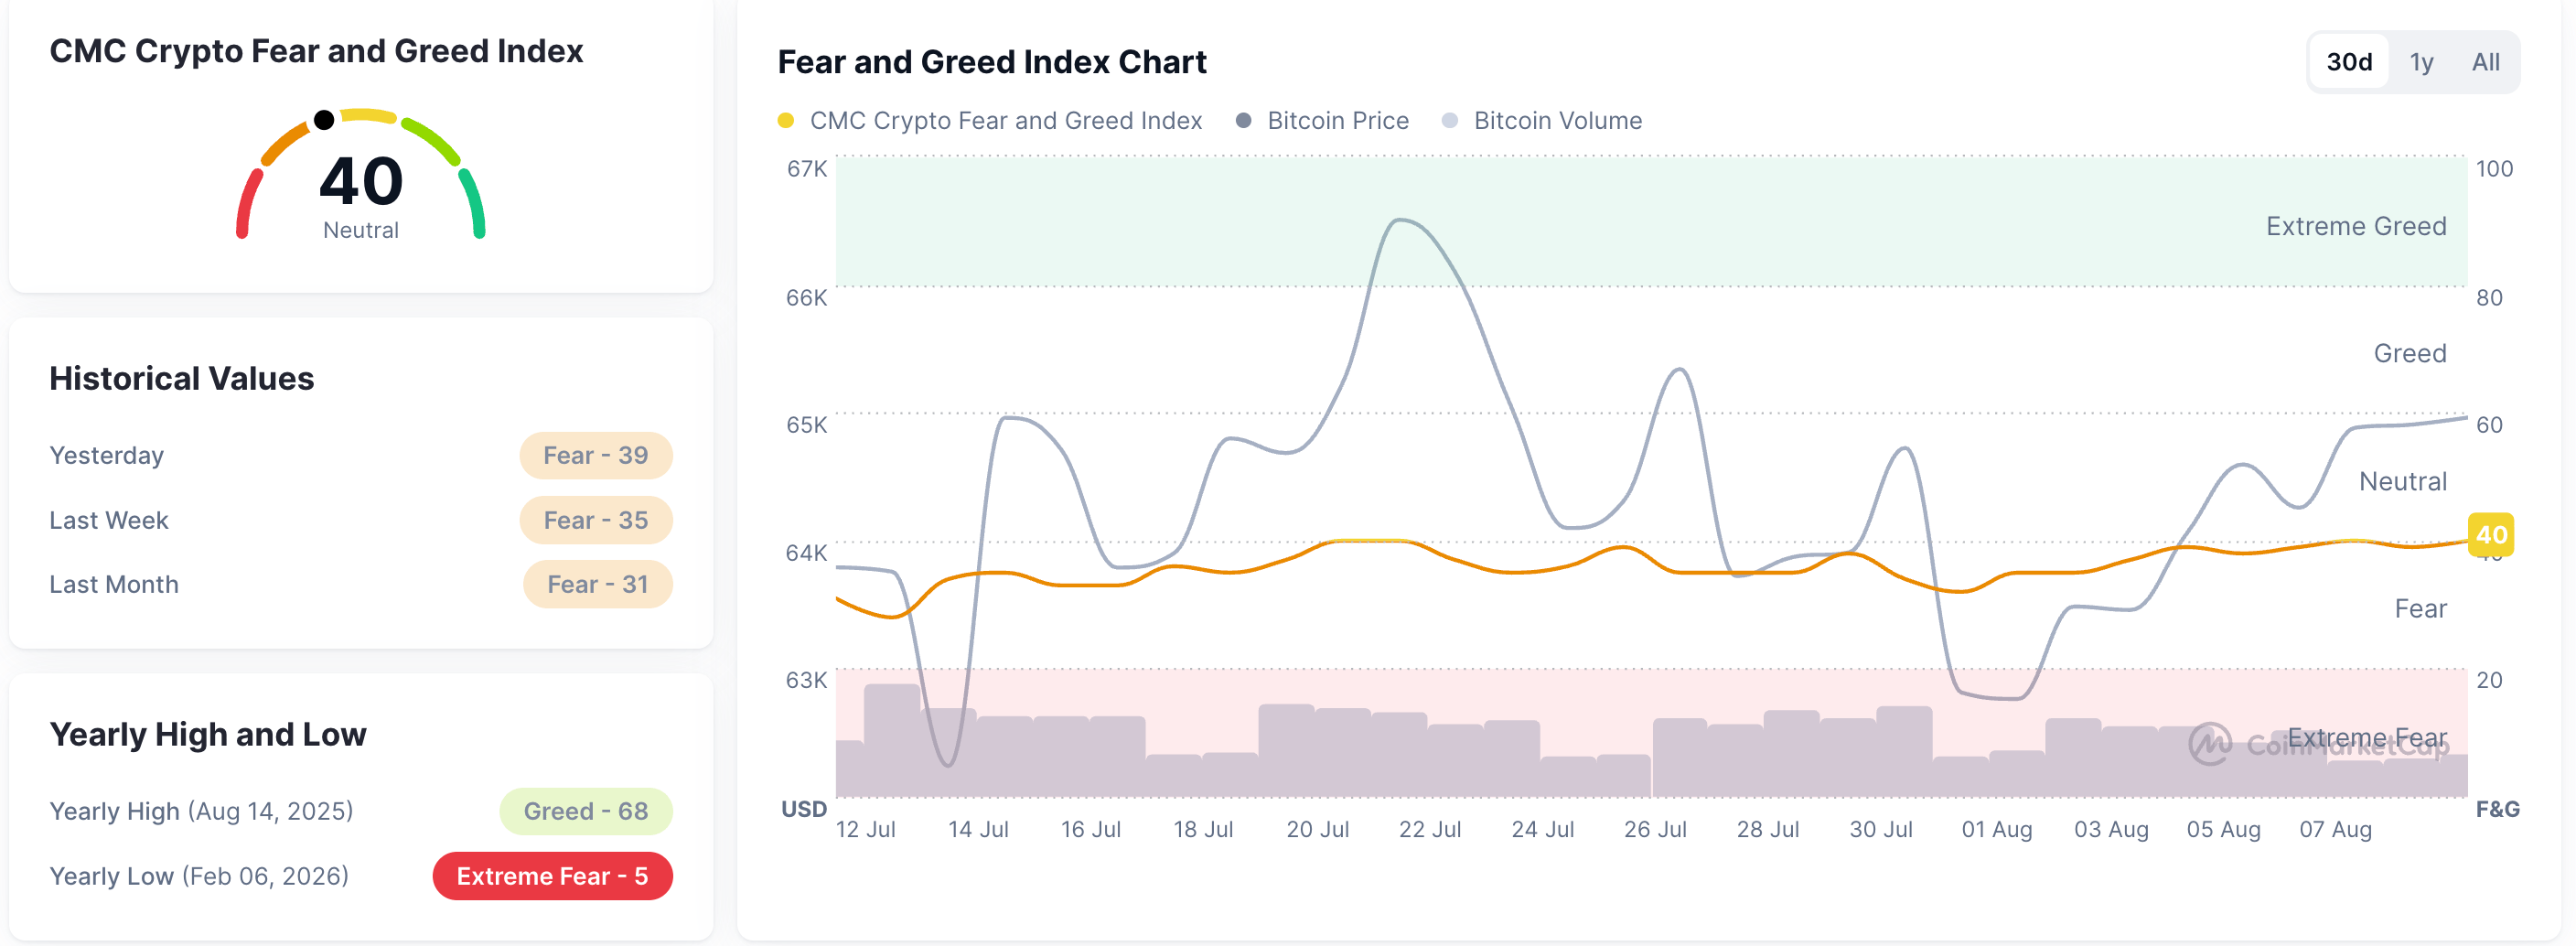
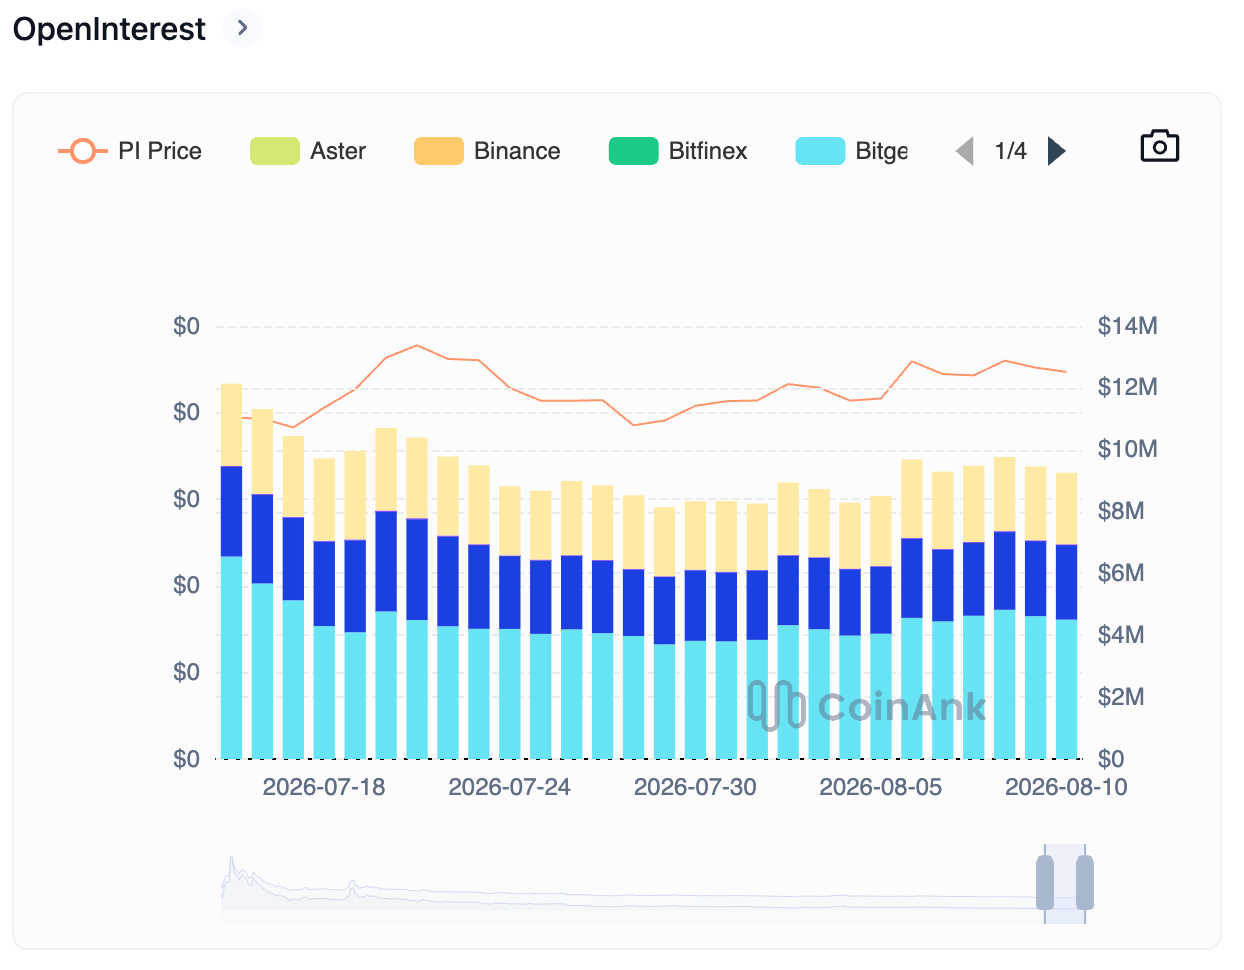
- PI Open Interest remains above $9 million, while the Fear and Greed Index at 40 indicates a mild recovery in market sentiment.
- The technical outlook for PI indicates a mild bearish bias as the price remains capped below $0.1000.
Pi Network (PI) extends losses Monday after a bearish close the previous day, as price remains capped below the $0.1000 psychological threshold. Speculative demand for PI is low, with Open Interest holding above $9 million as broader market sentiment improves. The technical outlook for PI indicates a mild bearish bias as the $0.0961 resistance level remains intact.

Could PI regain retail strength amid broader market recovery?
The broader cryptocurrency market shows early signs of improving risk appetite, with the Fear and Greed Index at 40 indicating a neutral shift out of the Fear zone. Meanwhile, speculative demand for Pi Network is holding steady in the near term. CoinAnk data shows the PI futures Open Interest at $9.26 million, holding above $9 million over the last six days. Taken together, the steady positional buildup amid improving broader market conditions implies a mild bullish bias.
Technical outlook: Will Pi Network reclaim $0.10?
Pi Network maintains a broader bearish structure as the price holds below the 127.2% Fibonacci extension level, measured from $0.1998 to $0.1183, at $0.0961. At the time of writing, PI edges lower on Monday, reaffirming the intense pressure near $0.0961.
The Moving Average Convergence Divergence (MACD) is above its signal line and rising higher in negative territory, indicating easing bearish pressure. At the same time, the Relative Strength Index (RSI) near 49 shows a steady recovery nearing the midline.
To further extend its recovery, PI should clear above $0.0961, which could open the path toward the $0.1183 Fibonacci anchor.
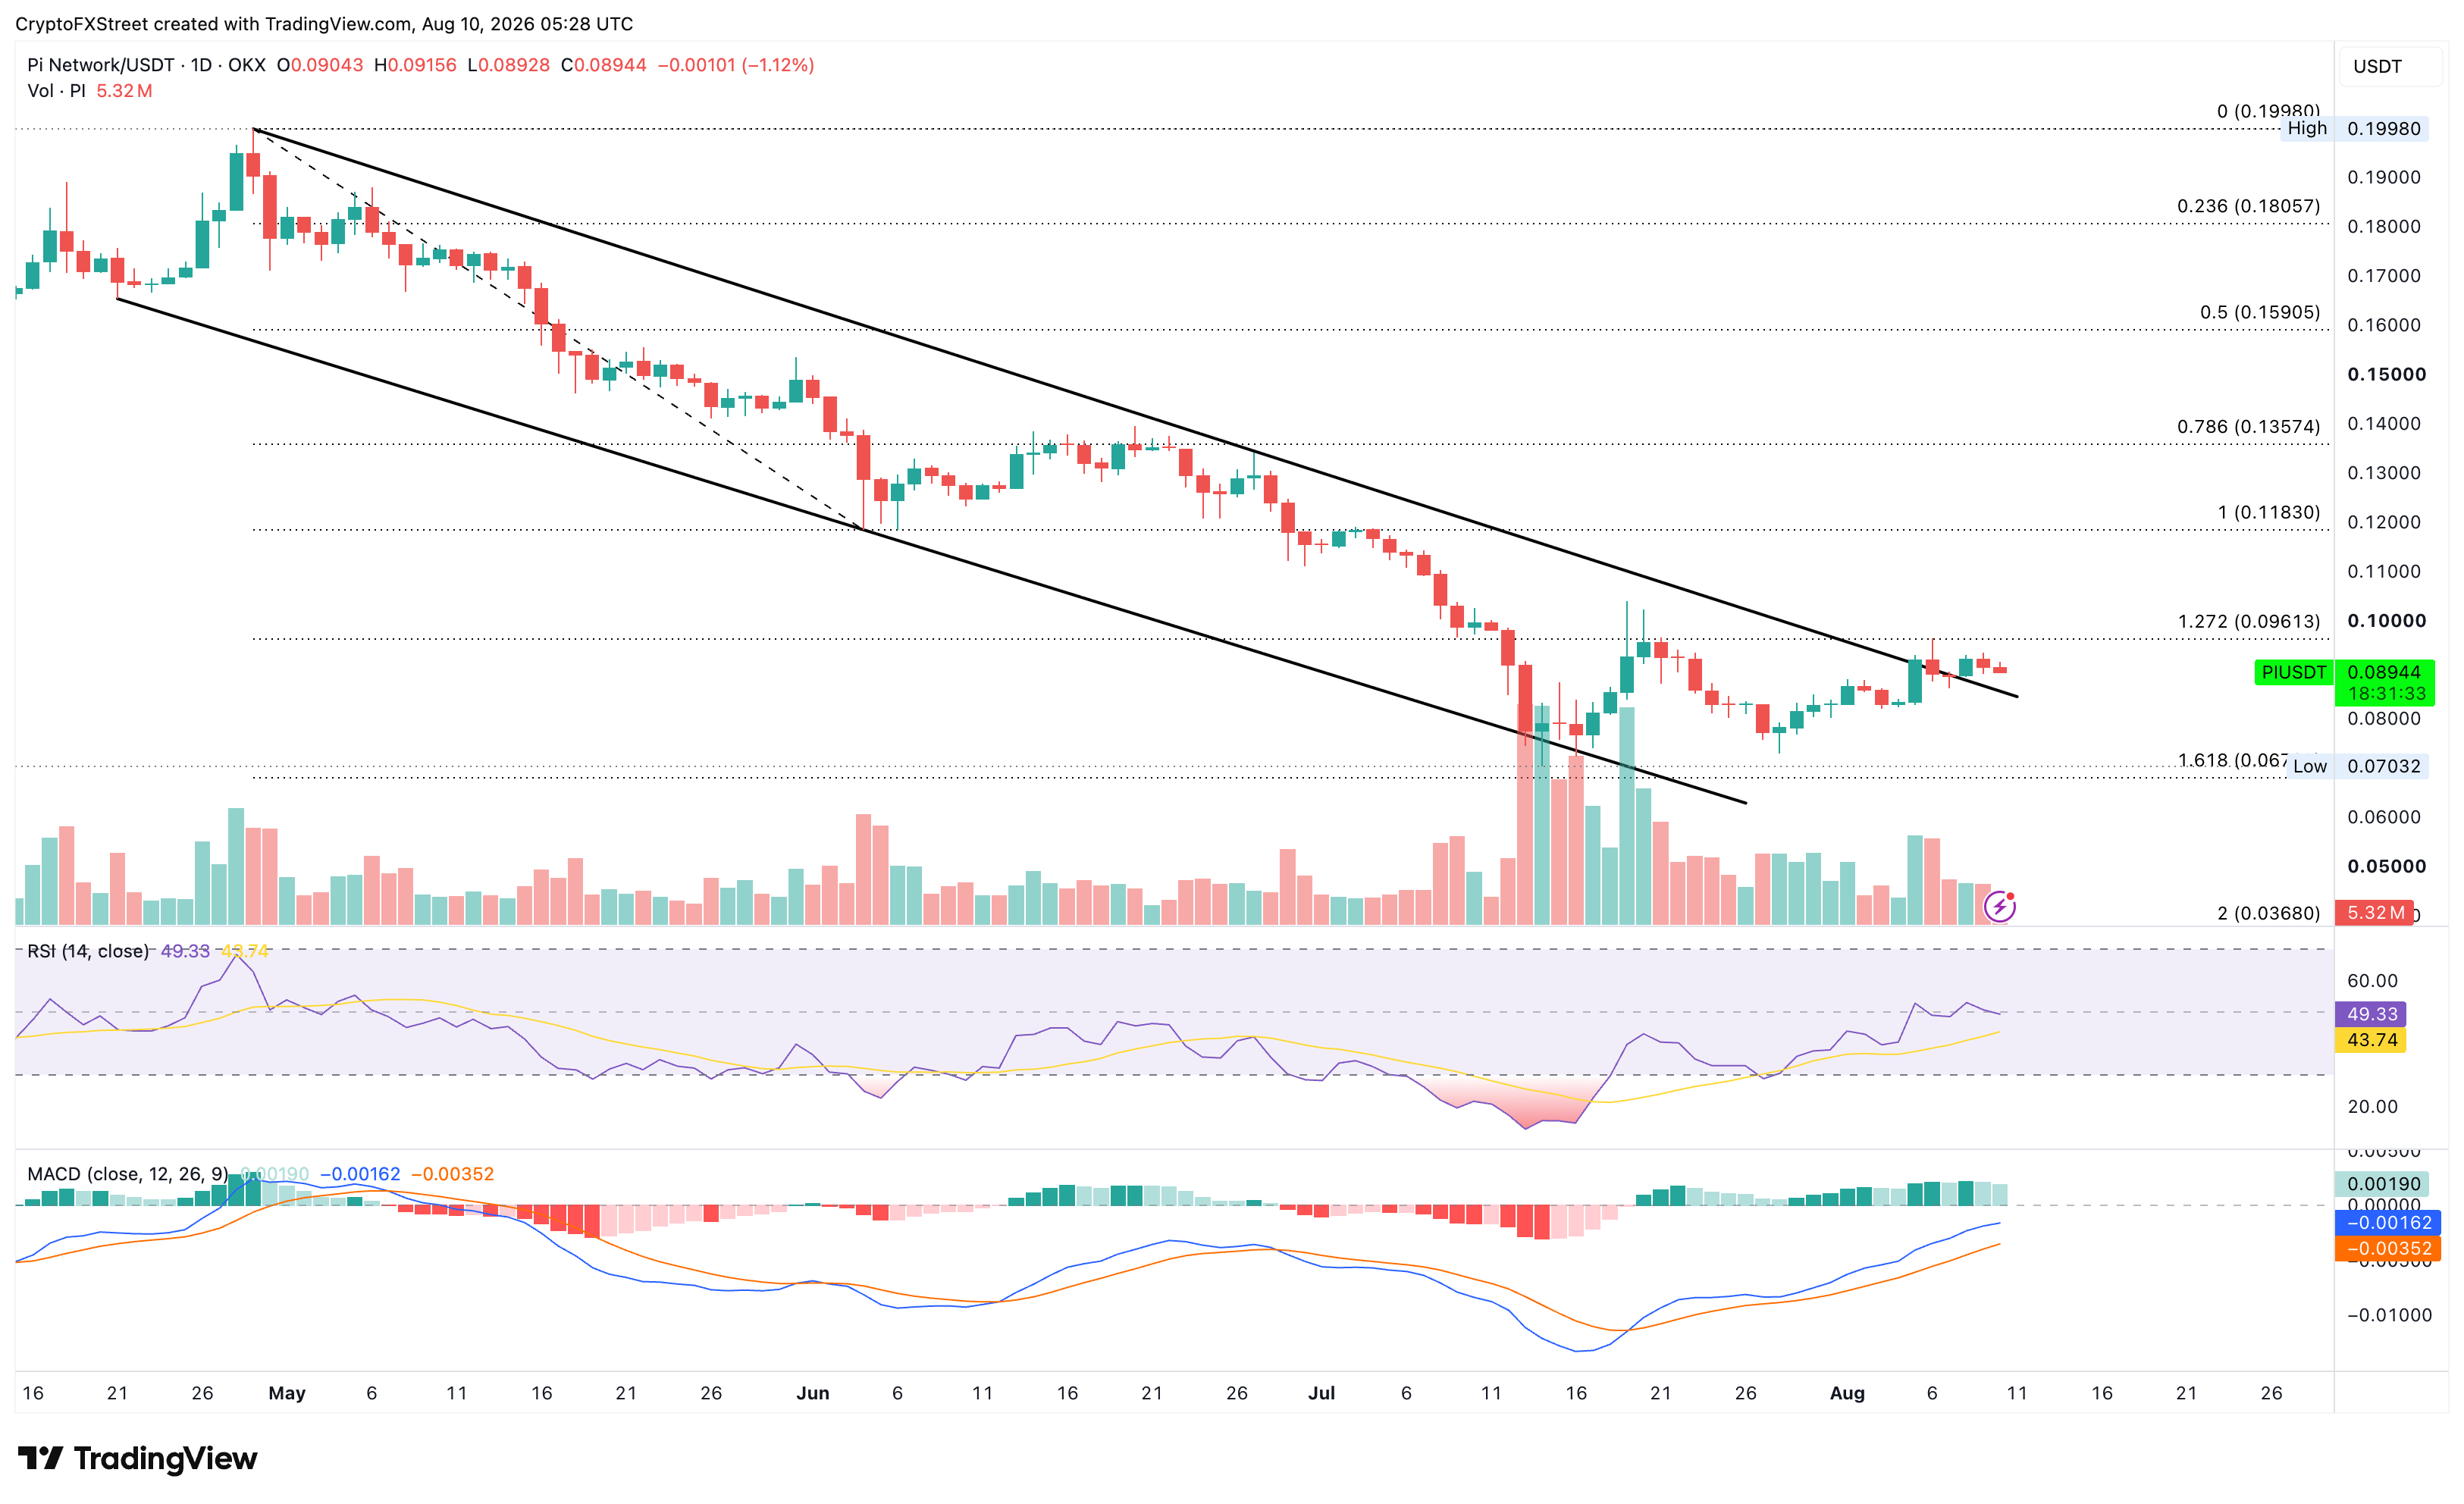
Looking down, the broken descending trendline near $0.0950 emerges as the immediate support, followed by the $0.0700 record low.
(The technical analysis of this story was written with the help of an AI tool. Know more.)













