




Ondo Price Forecast: ONDO vulnerable to deeper losses amid CLARITY Act delay
- Ondo is down over 2% on Friday, testing the bearish breakout of the 100-day EMA at $0.3530.
- The US Senate announced a delay in the vote on the CLARITY Act, weighing on crypto platforms that offer tokenized RWAs.
- Declining Open Interest and negative funding rates indicate easing retail demand for ONDO.
Ondo (ONDO) is down over 2% on Friday, extending its 4% decline from the previous day, as the US Senate delays the floor vote on the crypto CLARITY Act to next month, weighing on Ondo. Retail demand for ONDO eases as Open Interest declines and funding rates turn negative. The technical outlook for ONDO is bearish as the downside momentum gains traction.

Retail demand eases amid CLARITY Act delays
The delay in the CLARITY Act vote until September after the August recess, as previously reported by FXStreet, weighs on Ondo, as it offers tokenized Real-World Assets (RWAs) such as treasuries, stocks, and other securities that depend heavily on clear US regulations for institutional adoption. The CLARITY Act is also expected to open doors to on-chain capital markets, backed by multiple US national agencies and institutional players.
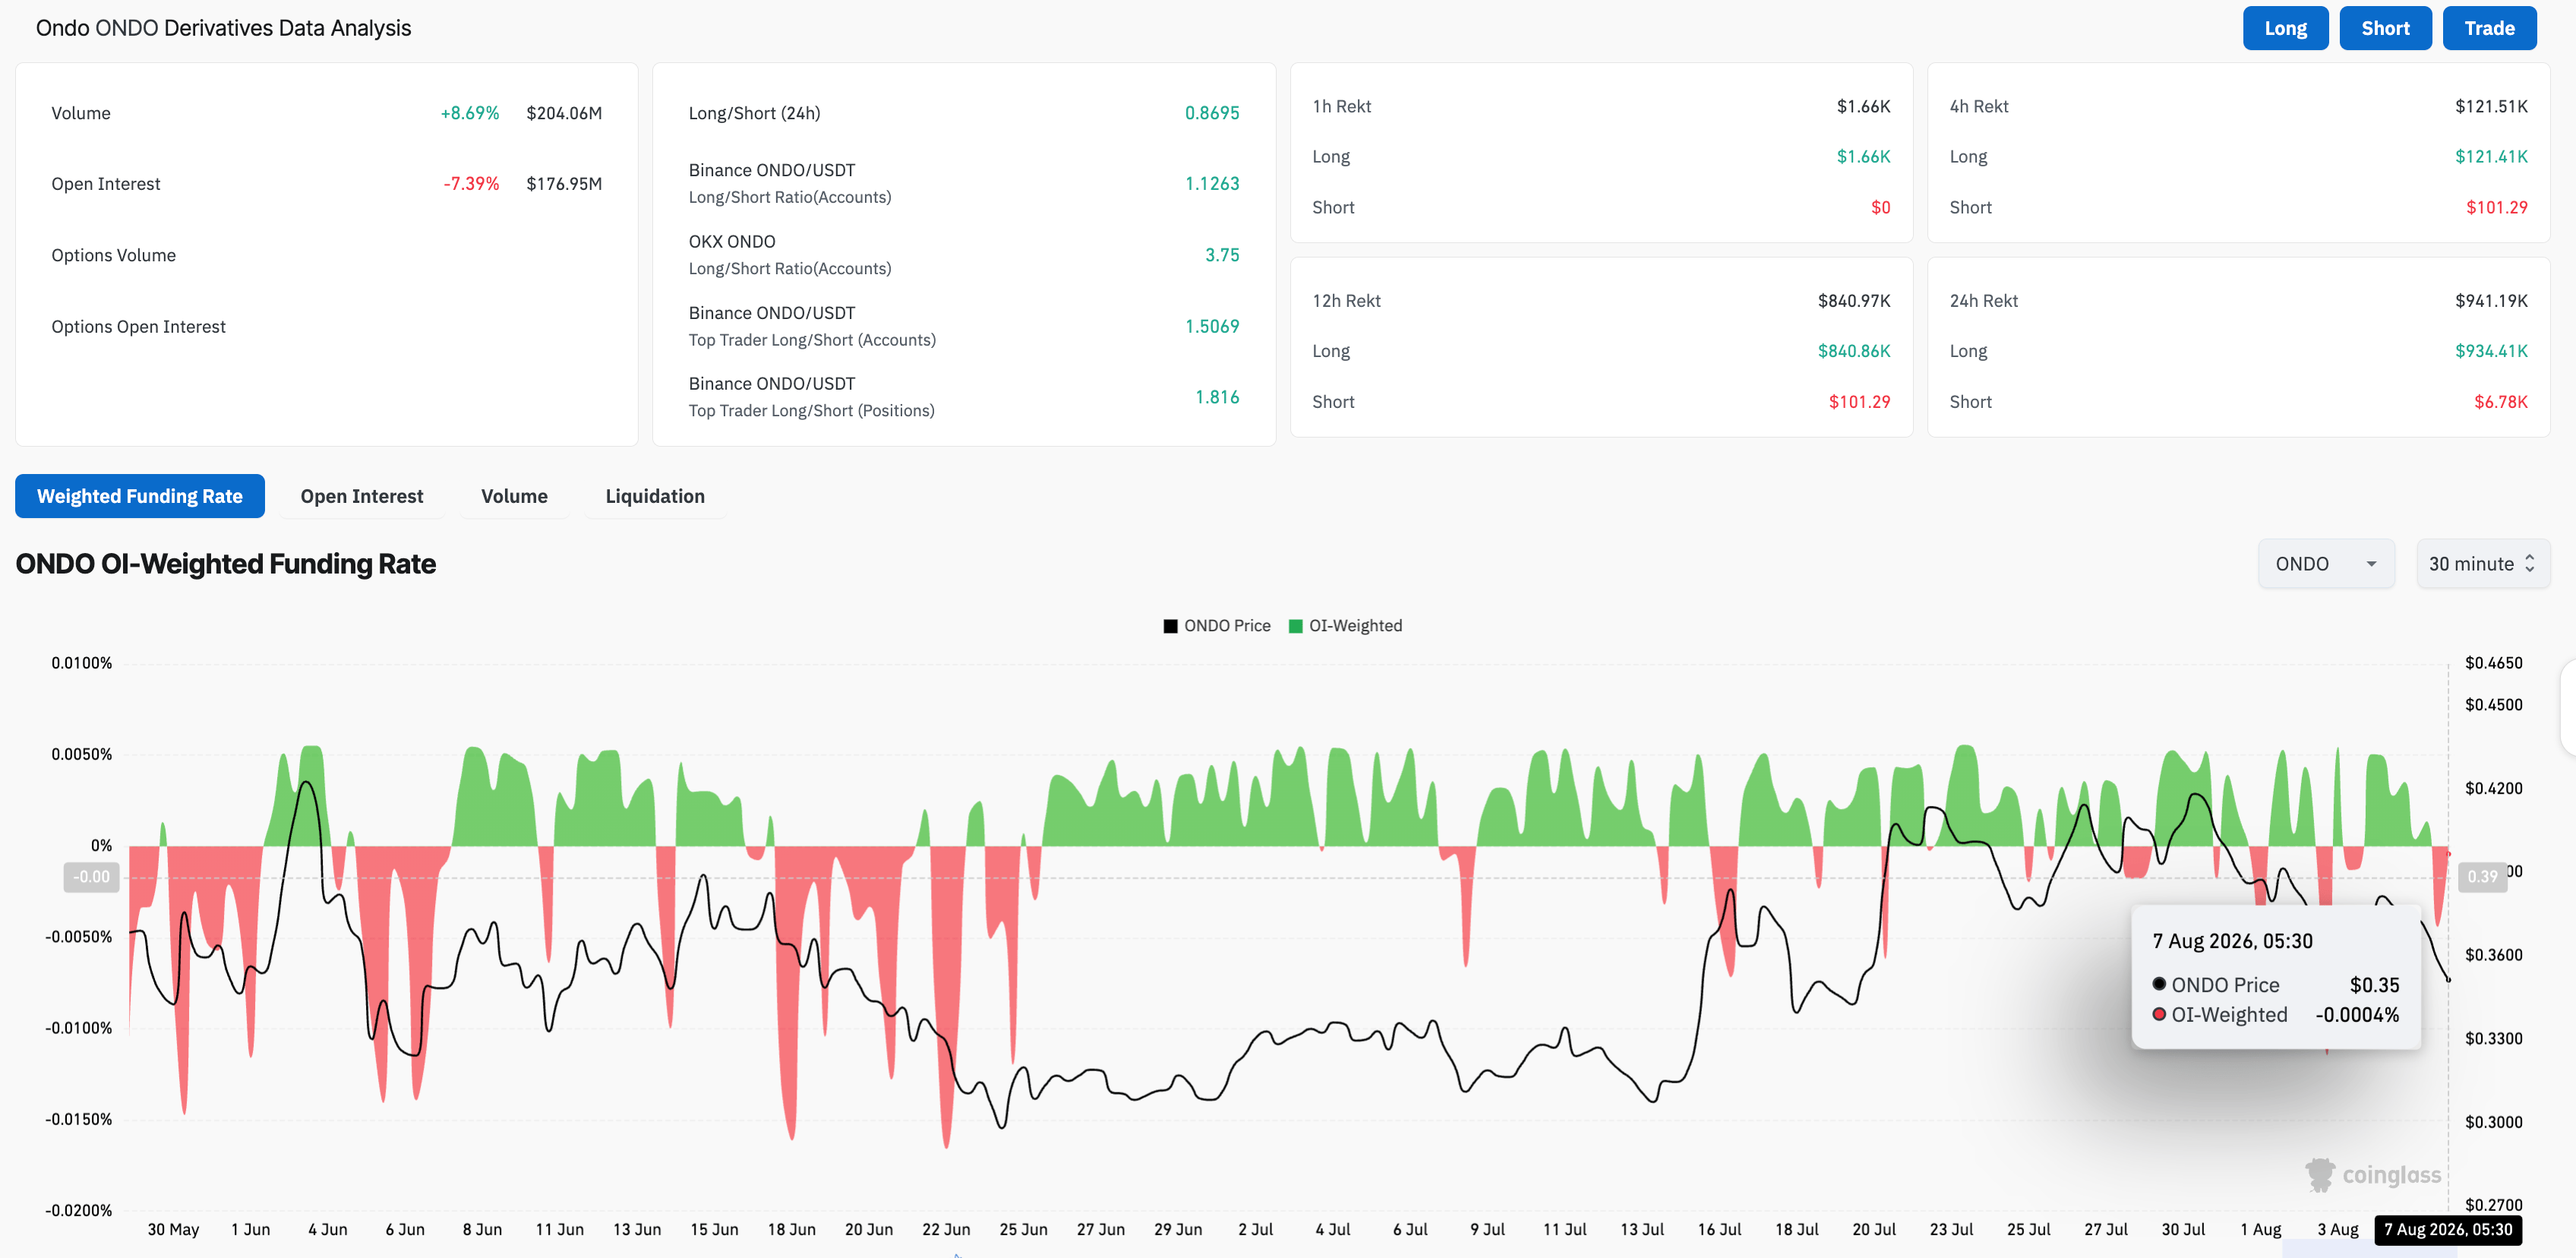
On the derivatives side, CoinGlass data shows that ONDO futures Open Interest (OI) is down 7% over the last 24 hours to $176.95 million, indicating either a positional wipeout or a contraction in the notional value of active contracts as the spot price falls. Liquidation data supports the positional unwinding, as long liquidation of $941,190 outpaced short liquidation of $6,780 in the same time period. In addition, the funding rate has flipped negative, at -0.0004%, indicating reduced bullish bias.
Technical outlook: Will ONDO drop below $0.30?
ONDO trades in the red on Friday, extending a steep correction seen over the last week. ONDO trades below the 200-day and 50-day Exponential Moving Averages (EMAs) at $0.3814 and $0.3629, respectively, while testing the breakout below the 100-day EMA at $0.3531.
A decisive close below $0.3531 could extend the decline toward the rising support trendline near $0.3295, where dip-buying interest could emerge if selling pressure resumes. However, a decisive breakout could threaten the $0.2968 support level marked by the February 3 high.
Momentum indicators echo a soft bearish bias, with the Relative Strength Index (RSI) hovering near 43 on the daily chart and Moving Average Convergence Divergence (MACD) crossing below its signal line with an expanding negative histogram, hinting at growing downside pressure.
On the topside, initial resistance is seen at the 50-day EMA at $0.3629, with the 200-day EMA at $0.3814 acting as a more significant barrier.
(The technical analysis of this story was written with the help of an AI tool. Know more.)













