
News & AnalysisCareer

At around 0.6645, the Australian Dollar (AUD) is trading close to a fresh near-11-month low against the US Dollar (USD) in Friday’s early European session. Hawkish signals from the Federal Reserve (Fed) are supporting the US Dollar’s outperformance, keeping AUD/USD under pressure. The Australian currency also remains weak amid hopes that the Reserve Bank of Australia’s (RBA) monetary tightening cycle is over.

Among the major currencies listed below, the Australian Dollar has seen the strongest performance by the US Dollar (USD) against it this week. The table sets out the US Dollar’s weekly percentage changes against each currency.
| USD | EUR | GBP | JPY | CAD | AUD | NZD | CHF | |
|---|---|---|---|---|---|---|---|---|
| USD | 0.44% | 0.84% | -0.35% | 0.50% | 1.64% | 0.63% | 0.40% | |
| EUR | -0.44% | 0.37% | -0.75% | 0.01% | 1.18% | 0.14% | -0.08% | |
| GBP | -0.84% | -0.37% | -1.11% | -0.36% | 0.80% | -0.24% | -0.45% | |
| JPY | 0.35% | 0.75% | 1.11% | 0.69% | 1.92% | 0.83% | 0.72% | |
| CAD | -0.50% | -0.01% | 0.36% | -0.69% | 1.25% | 0.15% | -0.09% | |
| AUD | -1.64% | -1.18% | -0.80% | -1.92% | -1.25% | -1.03% | -1.24% | |
| NZD | -0.63% | -0.14% | 0.24% | -0.83% | -0.15% | 1.03% | -0.22% | |
| CHF | -0.40% | 0.08% | 0.45% | -0.72% | 0.09% | 1.24% | 0.22% |
Percentage movements between the major currencies are displayed in the heat map. Select the base currency in the left-hand column and the quote currency in the top row. For instance, reading across from the US Dollar on the left to the Japanese Yen gives the percentage change for USD (base)/JPY (quote) in the corresponding cell.
A decline of 0.12% leaves the US Dollar Index (DXY) near 103.80 at the time of writing, although it remains close to the fresh 19-month high of 104.00 reached the day before. The index measures the Greenback against six major currencies.
Fed hawks retain two-hike outlook as risk of a larger increase grows
The latest policy indications strengthen the case for a firmly hawkish Federal Reserve, according to economists at UOB Group, who are “maintaining our view of two more rate hikes (Dec and 1Q 2027), while recognizing rising risks of an outsized hike.” Recalling the FOMC meeting on 27–28 Oct 2026, they say policymakers “decided to maintain the Fed Funds Target Rate (FFTR) at 3.75–4.00%, following the 25-bps increase delivered in September.” A “10–2 vote” backed the unchanged-rate decision, but the minutes revealed that “almost all participants viewed further policy tightening as likely to be appropriate in coming months under their baseline outlooks.”
For UOB, the October FOMC minutes “confirmed a firmly hawkish consensus, with almost all participants judging that additional tightening would be needed under their baseline outlooks for inflation and the labor market.” Later comments from the Fed added weight to that message. Speaking to CNBC on Wed (18 Nov), Fed Governor Waller, whom UOB describes as a “permanent voter,” “escalated the policy debate by urging officials to consider a 50 bps hike at the Dec FOMC meeting, citing annualized inflation running near 3.5% in the last three months and that inflation is headed in the wrong direction and spreading beyond energy.”
UOB’s assessment nevertheless stops short of forecasting a prolonged tightening cycle: “we do not believe this is the start of a long series of hikes.” It also reiterates that “we continue to emphasize we do not think this is a ‘one-and-done hike’ from the Fed, and as per previous rate hike cycles, the Fed usually does not stop at one.” The bank’s central expectation remains that “we still expect two additional 25-bps hikes, in Dec 2026 and 1Q 27, thereafter on hold for the rest of 2027 as inflation fades in a more durable fashion in the later part of 2027 as the most likely course of action,” while “recognising growing risks of a larger-than-expected tightening response if inflation remains persistent.”
Weaker Australian labour market reduces expectations of further RBA hikes
Deteriorating Australian labour market figures are reducing the likelihood of another RBA rate rise, in Rabobank analysts’ view. They describe an economy in which “unemployment is spiking (from 4.7% to 4.9%) and jobs growth was -43.5K vs. an expected +25K,” with these developments “making further rate hikes less likely.” Even so, they warn that next week’s October CPI figures “could still show a sharp headline lift.” The policy outlook therefore remains finely balanced, despite weaker employment data curbing expectations of further tightening.
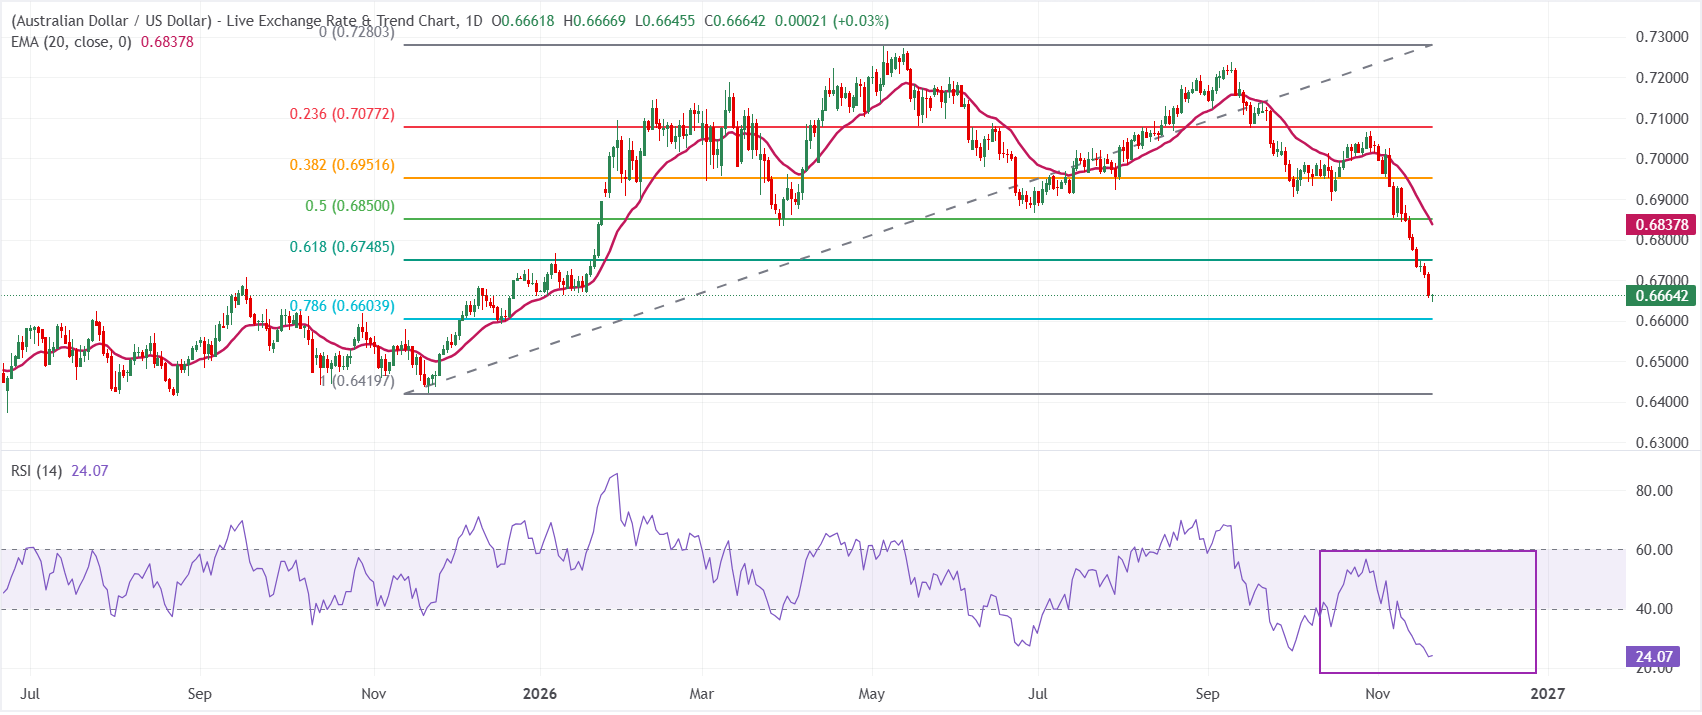
Trading at 0.6665 on the daily chart, AUD/USD retains a distinctly bearish outlook below both the 20-period exponential moving average (EMA) at 0.6838 and important Fibonacci retracement levels. A Relative Strength Index (14) reading of around 24, near oversold territory, suggests downside momentum is stretched. However, no meaningful recovery has yet emerged, with the pair still constrained by these successive resistance levels.
The first upside barrier lies at 0.6748, the 61.8% Fibonacci retracement. Beyond that sit the 20-day EMA at 0.6838 and the 50% retracement near 0.6850, followed by further resistance at the 38.2% level around 0.6952 and at 0.7077. Immediate downside support is provided by the 78.6% retracement at 0.6604. A breach would bring the lower Fibonacci anchor around 0.6420 into view as the next potential target for sellers.
(The technical analysis of this story was written with the help of an AI tool. Know more.)
Published by the Australian Bureau of Statistics, the Unemployment Rate expresses unemployed workers as a percentage of the total civilian labour force. A rise signals that Australia’s labour market is failing to expand and that the economy is weak. A lower reading is regarded as bullish for the Australian Dollar (AUD); a higher one is regarded as bearish.
Continue reading.Latest release: Thu 19 Nov 2026 00:30
Release frequency: Monthly
Reported figure: 4.9%
Consensus forecast: 4.7%
Prior reading: 4.7%
Data source: Australian Bureau of Statistics
The unemployment rate is a closely monitored measure in the Australian Bureau of Statistics (ABS) overview of Australian labour market trends. Published around 15 days after the end of the month, the indicator offers insight into broader economic conditions through its strong correlation with consumer spending and inflation. Although it is a lagging indicator, it influences interest rate decisions at the Reserve Bank of Australia (RBA), which in turn move the Australian dollar. A favourable reading tends to support the AUD.







Phone: +61 2 8036 8388
Fax: +61 2 8036 8388
Email: support@tmgm.com



The information provided on this website is of a general nature only and does not constitute personal financial advice. Before acting on any information on this website, you should consider the suitability of the information in relation to your objectives, financial situation and needs. Investing in CFDs and FX Margin Contracts carries significant risks and is not suitable for all investors. You may lose more than your initial deposit. You do not own, or have, any interest in the underlying asset. We recommend that you seek independent advice and ensure you fully understand the risks involved before trading. It is important that you read and consider the disclosure document before you acquire any product listed on the website. The information and advertisements offered on this website are not intended for use by any person in any country or jurisdiction where such use would be contrary to local laws and regulations. The Products and Services offered on this website are not intended for residents of the United States, Malaysia and Thailand.
TMGM is authorized and regulated in various jurisdictions.
Trademax Australia Limited, trading as TMGM, is regulated by the Australian Securities and Investments Commission (ASIC), AFSL no. 436416 and is located at Level 28, One International Tower, 100 Barangaroo Avenue, 2000 Sydney, NSW Australia.
Email: support@tmgm.com.au
Trademax Global Limited, trading as TMGM, is authorized and regulated by the Vanuatu Financial Services Commission (VFSC), registration number 40356 and registered at 1276, Kumul Highway, Port Vila, Vanuatu, Republic of Vanuatu.
Email: support@tmgm.com
Trademax Global Markets (SE) Limited, trading as TMGM, is authorized and regulated by the Financial Services Authority (FSA) of Seychelles, with license number SD224. The company is registered at Office No 13, Providence Estate ABIS Centre, Mahe, Seychelles.
Email: support@tmgm.com
Trademax Global Markets (International) Pty Ltd, trading as TMGM, is authorized and regulated by the Financial Services Commission, Mauritius (FSC) with license no. GB22201012, and registered at 33, Edith Cavell Street C/o IQ EQ Fund Services (Mauritius) Ltd Port Louis, 11324 Mauritius.
Email: support@tmgm.com
Copyright © TMGM. All rights reserved

