

Trading
Explore a wide range of markets with competitive pricing, deep liquidity, and advanced trading tools.
Learn More 
Platform
Trade seamlessly with TMGM's powerful platform, built for speed, precision, and a superior trading experience.
Learn More Trading Platform
Academy
Learn the fundamentals of trading with beginner-friendly resources, including guides, webinars, and market insights.
Learn More News & Analysis
Get real-time market updates and expert analysis to stay ahead of trading opportunities
Learn More News & Analysis
About
Learn what sets TMGM apart — our global presence, regulatory strength, and commitment to innovation in trading.
Learn More Why Choose TMGM
Sponsorship
Silver Price Forecast: XAG/USD approaches oversold territory after CPI-driven sell-off
- Silver comes under heavy selling pressure as hotter-than-expected US inflation fuels Fed interest rate-hike bets.
- The technical outlook remains bearish as XAG/USD trades well below its key daily SMAs.
- The RSI approaches oversold territory, while the MACD signals persistent selling pressure.
Silver (XAG/USD) tumbles over 5.5% on Wednesday as stronger-than-expected US inflation data fuel expectations of further Federal Reserve (Fed) rate hikes, sending the US Dollar (USD) to a fresh year-to-date high. At the time of writing, XAG/USD trades around $55.78, its lowest level since July.

Data released by the US Bureau of Labor Statistics showed headline inflation rose to 3.7% YoY in September from 3.4% in August, beating expectations of 3.6%. Core inflation, which excludes food and energy, increased to 2.6% from 2.4%, above the 2.5% forecast. On a monthly basis, headline CPI rose 0.6%, as expected, while core CPI increased 0.3%, slightly above the 0.2% forecast.
According to the CME FedWatch Tool, traders now price in a 43% chance of a rate hike at the Fed’s October 27-28 meeting, up from 22% before the release, while the probability of a December rate hike stands near 95%.
Higher borrowing costs make interest-bearing assets more attractive, reducing demand for Silver, which generates no income. A stronger US Dollar adds to the pressure by making the metal more expensive for overseas buyers. Meanwhile, the technical picture suggests sellers remain firmly in control.
Technical analysis
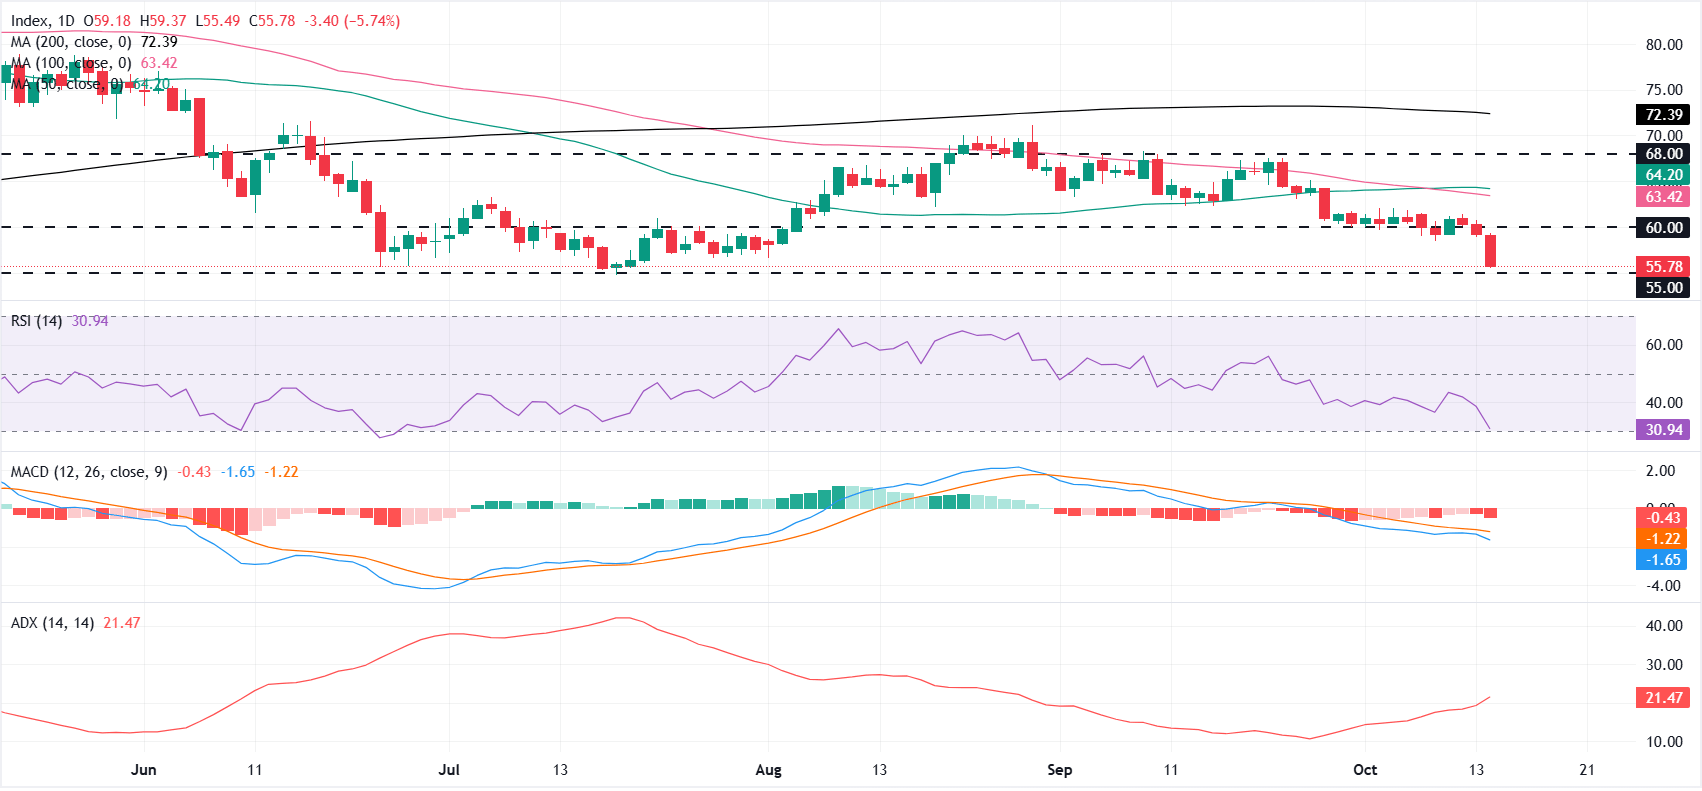
On the daily chart, XAG/USD trades well below the 50-day, 100-day and 200-day Simple Moving Averages (SMAs), clustered between roughly $63 and $72. The latest leg lower brings Silver back toward July’s lows, which also mark its year-to-date lows.
Momentum indicators remain bearish. The Relative Strength Index (RSI) near 30 approaches oversold territory, suggesting the decline is becoming stretched, while the Moving Average Convergence Divergence (MACD) remains negative, reinforcing persistent bearish momentum despite the lack of strong trend strength suggested by the Average Directional Index (ADX) at 21.
On the topside, initial resistance lies at the $60 psychological mark, followed by the 100-day SMA at $63 and the 50-day SMA at $64. This moving-average cluster forms a firm resistance zone ahead of $68 and the 200-day SMA at $72.
On the downside, a sustained break below July’s lows in the $55.00-$55 area could open the door to a deeper decline toward $50. Holding this support zone could encourage a corrective bounce from oversold levels rather than a decisive trend reversal.
(The technical analysis of this story was written with the help of an AI tool. Know more.)
Silver FAQs
Silver is a precious metal highly traded among investors. It has been historically used as a store of value and a medium of exchange. Although less popular than Gold, traders may turn to Silver to diversify their investment portfolio, for its intrinsic value or as a potential hedge during high-inflation periods. Investors can buy physical Silver, in coins or in bars, or trade it through vehicles such as Exchange Traded Funds, which track its price on international markets.
Silver prices can move due to a wide range of factors. Geopolitical instability or fears of a deep recession can make Silver price escalate due to its safe-haven status, although to a lesser extent than Gold's. As a yieldless asset, Silver tends to rise with lower interest rates. Its moves also depend on how the US Dollar (USD) behaves as the asset is priced in dollars (XAG/USD). A strong Dollar tends to keep the price of Silver at bay, whereas a weaker Dollar is likely to propel prices up. Other factors such as investment demand, mining supply – Silver is much more abundant than Gold – and recycling rates can also affect prices.
Silver is widely used in industry, particularly in sectors such as electronics or solar energy, as it has one of the highest electric conductivity of all metals – more than Copper and Gold. A surge in demand can increase prices, while a decline tends to lower them. Dynamics in the US, Chinese and Indian economies can also contribute to price swings: for the US and particularly China, their big industrial sectors use Silver in various processes; in India, consumers’ demand for the precious metal for jewellery also plays a key role in setting prices.
Silver prices tend to follow Gold's moves. When Gold prices rise, Silver typically follows suit, as their status as safe-haven assets is similar. The Gold/Silver ratio, which shows the number of ounces of Silver needed to equal the value of one ounce of Gold, may help to determine the relative valuation between both metals. Some investors may consider a high ratio as an indicator that Silver is undervalued, or Gold is overvalued. On the contrary, a low ratio might suggest that Gold is undervalued relative to Silver.
POPULAR ARTICLES
1Fed’s Barkin says CPI ran too hot, keeps October decision open2EUR/USD Price Forecast: Strong US CPI keeps bears in control despite oversold RSI3Fed Beige Book flags price pressures intensifying4Chinese Yuan: Upside risk below 6.6900 against US Dollar – UOB5Forex Today: More US inflation alongside jobs in Oz6Gold crashes below $4,100 as hot CPI revives October Fed hike bets7Silver Price Forecast: XAG/USD approaches oversold territory after CPI-driven sell-off8New Zealand Dollar plunges to 18-month low as hot US inflation fuels US Dollar rally9US Dollar Index roars towards 103 as hot CPI reignite Fed hike bets
LIVE QUOTES

Get Started!
Sign up and access the Global Markets in less than 3 minutes

Connect With Us









Contacts
Phone: +61 2 8036 8388
Fax: +61 2 8036 8388
Email: support@tmgm.com



The information provided on this website is of a general nature only and does not constitute personal financial advice. Before acting on any information on this website, you should consider the suitability of the information in relation to your objectives, financial situation and needs. Investing in CFDs and FX Margin Contracts carries significant risks and is not suitable for all investors. You may lose more than your initial deposit. You do not own, or have, any interest in the underlying asset. We recommend that you seek independent advice and ensure you fully understand the risks involved before trading. It is important that you read and consider the disclosure document before you acquire any product listed on the website. The information and advertisements offered on this website are not intended for use by any person in any country or jurisdiction where such use would be contrary to local laws and regulations. The Products and Services offered on this website are not intended for residents of the United States, Malaysia and Thailand.
TMGM is authorized and regulated in various jurisdictions.
Trademax Australia Limited, trading as TMGM, is regulated by the Australian Securities and Investments Commission (ASIC), AFSL no. 436416 and is located at Level 28, One International Tower, 100 Barangaroo Avenue, 2000 Sydney, NSW Australia.
Email: support@tmgm.com.au
Trademax Global Limited, trading as TMGM, is authorized and regulated by the Vanuatu Financial Services Commission (VFSC), registration number 40356 and registered at 1276, Kumul Highway, Port Vila, Vanuatu, Republic of Vanuatu.
Email: support@tmgm.com
Trademax Global Markets (SE) Limited, trading as TMGM, is authorized and regulated by the Financial Services Authority (FSA) of Seychelles, with license number SD224. The company is registered at Office No 13, Providence Estate ABIS Centre, Mahe, Seychelles.
Email: support@tmgm.com
Trademax Global Markets (International) Pty Ltd, trading as TMGM, is authorized and regulated by the Financial Services Commission, Mauritius (FSC) with license no. GB22201012, and registered at 33, Edith Cavell Street C/o IQ EQ Fund Services (Mauritius) Ltd Port Louis, 11324 Mauritius.
Email: support@tmgm.com
Copyright © TMGM. All rights reserved