

Trading
Explore a wide range of markets with competitive pricing, deep liquidity, and advanced trading tools.
Learn More 
Platform
Trade seamlessly with TMGM's powerful platform, built for speed, precision, and a superior trading experience.
Learn More Trading Platform
Academy
Learn the fundamentals of trading with beginner-friendly resources, including guides, webinars, and market insights.
Learn More News & Analysis
Get real-time market updates and expert analysis to stay ahead of trading opportunities
Learn More News & Analysis
About
Learn what sets TMGM apart — our global presence, regulatory strength, and commitment to innovation in trading.
Learn More Why Choose TMGM
Sponsorship
211.10 in bulls’ sights: GBP/JPY Price Forecast as bearish trend continues
- 209.13 marks the rebound point for GBP/JPY as buyers hold former trendline resistance.
- With RSI nearing bullish territory, short-term buying momentum is gaining strength.
- 211.10 is the breakout level that would bring 212.00 and the 200-day SMA at 212.95 into view.
GBP/JPY gains over 0.20% on Monday. Risk appetite is positive amid prospects of de-escalation in the Middle East conflict, while US equities trade higher and AI company Anthropic files for an IPO. After testing a six-day low of 209.13, the cross trades above 210.00.

GBP/JPY Price Forecast: Technical Levels in Focus
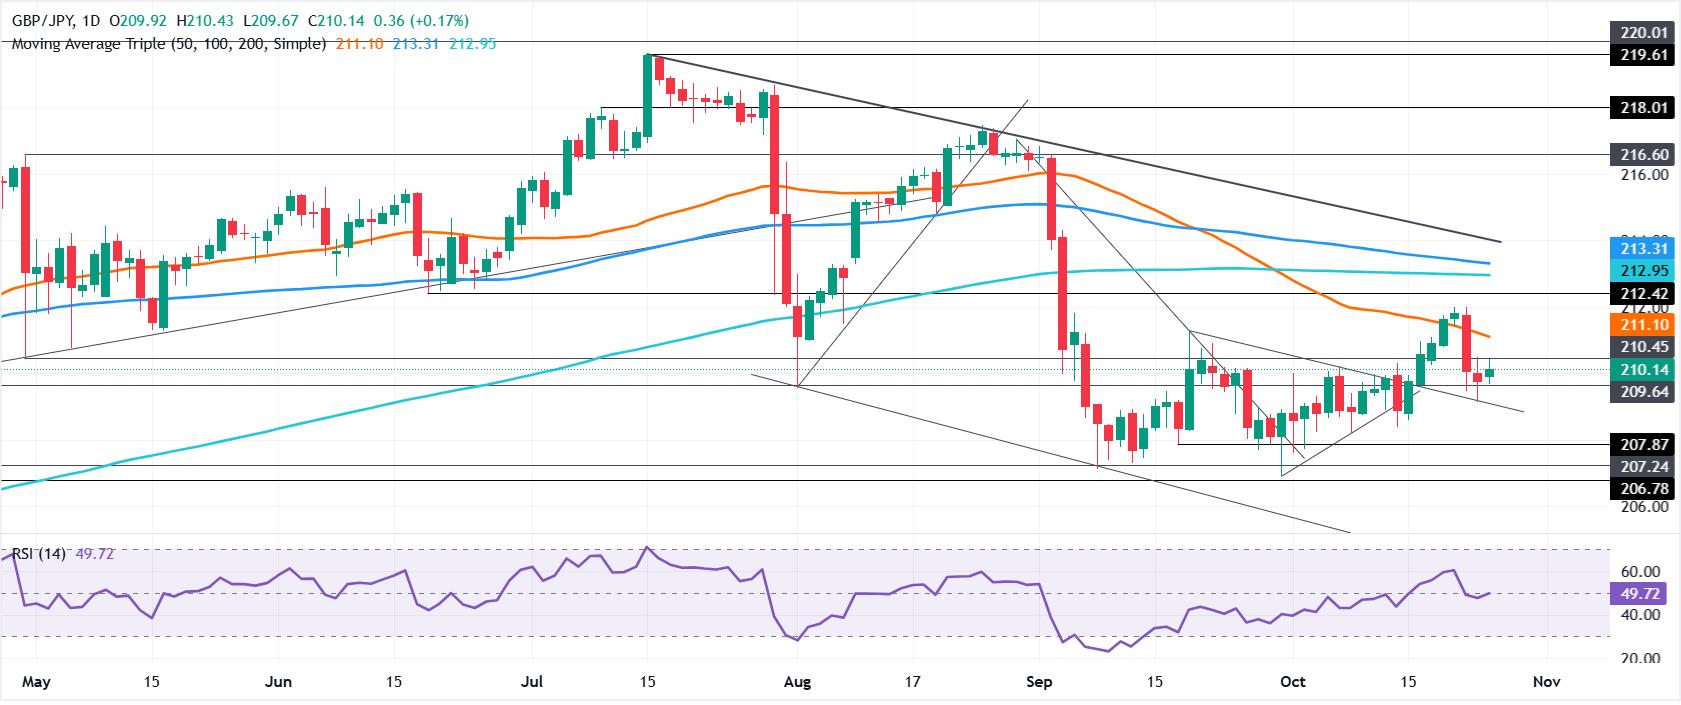
A break above descending trendline resistance in mid-October lifted GBP/JPY to a one-month high of 211.99. The cross has since pulled back towards the psychological 210.00 level, with its broader bias still pointing downwards.
Only a recovery above the 25 August high of 217.48 would disrupt GBP/JPY's established pattern of lower highs and lower lows.
The Relative Strength Index (RSI) is climbing towards bullish territory, with momentum pointing to additional gains.
A break above 211.00 could take GBP/JPY towards its 50-day Simple Moving Average (SMA) at 211.10. Further gains would bring 212.00 into focus, then the 200-day SMA at 212.95.
Conversely, a fall below the 23 October low of 209.13 would leave GBP/JPY vulnerable to a test of 209.00. Below that level, the next support lies at 209.00 on a trendline that previously acted as resistance. Losses could then extend towards the 30 September low of 206.89.
GBP/JPY Daily Price Chart
Pound Sterling: Key Questions
Dating back to 886 AD, the Pound Sterling (GBP) is the world's oldest currency and the United Kingdom's official currency. According to 2022 data, it ranks fourth in global foreign exchange (FX) trading, representing 12% of all transactions with average daily turnover of $630 billion. Its main trading pairs include GBP/USD, known as ‘Cable’, with an 11% share of FX trading; GBP/JPY, called the ‘Dragon’ by traders, at 3%; and EUR/GBP at 2%. The Bank of England (BoE) issues the Pound Sterling.
Monetary policy set by the Bank of England is the biggest influence on the Pound Sterling's value. Policy decisions depend on progress towards the BoE's main objective of “price stability” – inflation holding steady at around 2%. Interest rate adjustments are its principal means of achieving that goal. To curb excessively high inflation, the BoE raises interest rates, increasing borrowing costs for households and businesses. GBP generally benefits because higher rates make the UK more attractive to international investors seeking somewhere to place their funds. Inflation that falls too low signals weaker economic growth. The BoE would then consider cutting interest rates to reduce credit costs, encouraging businesses to borrow more for investment in projects that generate growth.
By revealing the economy's health, data releases can move the Pound Sterling. GDP, Manufacturing and Services PMIs, and employment figures are among the indicators that can shape GBP's direction. Sterling benefits from a robust economy through greater foreign investment and the possibility of BoE interest rate increases, which would directly strengthen GBP. Weak economic readings, by contrast, are likely to weigh on the Pound Sterling.
The Trade Balance is another important release for the Pound Sterling. Over a specified period, it compares a country's export earnings with its spending on imports. Strong overseas demand for a country's exports creates additional demand for its currency as foreign buyers purchase those goods. A positive net Trade Balance therefore supports the currency, while a negative balance has the opposite effect.
POPULAR ARTICLES
1Below 1.12: Euro faces Fed and ECB decisions a day apart2Pound retreats from its high ahead of UK Budget and Fed decision3Anthropic's filing boosts tech while Dow Jones Industrial Average trails4211.10 in bulls’ sights: GBP/JPY Price Forecast as bearish trend continues5Iran peace hopes buoy sentiment as Mexican Peso withstands Dollar strength6FOMC and Yields Shape Singapore Dollar (SGD) Trading Against US Dollar – OCBC7Chinese Yuan: UOB Sees Gradual Upside Bias Against US Dollar8Malaysian Ringgit: Resilience supported by trade surplus – OCBC9Forex Today: Markets stay cautious ahead of the Fed
LIVE QUOTES


Get Started!
Sign up and access the Global Markets in less than 3 minutes

Connect With Us









Contacts
Phone: +61 2 8036 8388
Fax: +61 2 8036 8388
Email: support@tmgm.com



The information provided on this website is of a general nature only and does not constitute personal financial advice. Before acting on any information on this website, you should consider the suitability of the information in relation to your objectives, financial situation and needs. Investing in CFDs and FX Margin Contracts carries significant risks and is not suitable for all investors. You may lose more than your initial deposit. You do not own, or have, any interest in the underlying asset. We recommend that you seek independent advice and ensure you fully understand the risks involved before trading. It is important that you read and consider the disclosure document before you acquire any product listed on the website. The information and advertisements offered on this website are not intended for use by any person in any country or jurisdiction where such use would be contrary to local laws and regulations. The Products and Services offered on this website are not intended for residents of the United States, Malaysia and Thailand.
TMGM is authorized and regulated in various jurisdictions.
Trademax Australia Limited, trading as TMGM, is regulated by the Australian Securities and Investments Commission (ASIC), AFSL no. 436416 and is located at Level 28, One International Tower, 100 Barangaroo Avenue, 2000 Sydney, NSW Australia.
Email: support@tmgm.com.au
Trademax Global Limited, trading as TMGM, is authorized and regulated by the Vanuatu Financial Services Commission (VFSC), registration number 40356 and registered at 1276, Kumul Highway, Port Vila, Vanuatu, Republic of Vanuatu.
Email: support@tmgm.com
Trademax Global Markets (SE) Limited, trading as TMGM, is authorized and regulated by the Financial Services Authority (FSA) of Seychelles, with license number SD224. The company is registered at Office No 13, Providence Estate ABIS Centre, Mahe, Seychelles.
Email: support@tmgm.com
Trademax Global Markets (International) Pty Ltd, trading as TMGM, is authorized and regulated by the Financial Services Commission, Mauritius (FSC) with license no. GB22201012, and registered at 33, Edith Cavell Street C/o IQ EQ Fund Services (Mauritius) Ltd Port Louis, 11324 Mauritius.
Email: support@tmgm.com
Copyright © TMGM. All rights reserved